CAKE/USDT now 91% pure profit and still expecting more TPs#CAKE/USDT Profit Update:-
$CAKE currently trading at $21
And Our entry was $11 filled ✅
Now 91% pure profit within a month.
I am still expecting it will hit more TPs.
but I will suggest now you can free your principal amount and hold only Profit.
Entry was $11 ✅
TP1:- $21.50 ✅
TP2:- Pending
Support:- $18/$12
Resistance:- $27/$44
Please click like button and Appreciate my hard work.
Must follow me for latest crypto real time updates.
Thank you.
CAKEPERP trade ideas


PancakeSwap (CAKE) - August 10Hello?
Welcome, traders.
By "following", you can always get new information quickly.
Please also click "Like".
Have a nice day.
-------------------------------------
(CAKEUSD 1W Chart)
If the price is maintained above the 15.1757179-16.1961041 section, it is expected to create a new wave.
(1D chart)
If the price is maintained above the 20.0044522 point, we expect the uptrend to continue.
If it goes down, we should see support and see if we can move up the key zone of 10.8786252-16.1961041.
'How far will it rise...'
'If you know this, you will be able to realize profits...'
So, if you look at my chart, unfortunately, you can't tell.
Setting a target point is a good habit for good trades.
However, it must be a target point that you set yourself.
A goal set by someone else is practically meaningless because it's likely to be unbearable until you reach that goal, and your goal point may change along the way.
If you dare to set the target section on this chart, you can set it as the 38.3519782-40.8453058 section that forms the high point section.
Will you be able to climb all the way up at once to reach the goal section?
Will it be able to overcome the volatility that shakes up and down to the target section set by others?
“Where will the purchase principal be recovered from?”
You need to think about this.
'How to increase the number of tokens remaining by recovering the purchase principal'
-------------------------------------
(CAKEBTC 1W chart)
There is nothing to tell from this chart.
However, if the price is maintained above the 26870 Satoshi-29030 Satoshi section, it is expected that the upward trend will continue.
(1D chart)
If the price holds above the 34500 Satoshi point, it is expected to turn into an uptrend.
------------------------------------------
We recommend that you trade with your average unit price.
This is because, if the price is below your average unit price, whether it is in an uptrend or in a downtrend, there is a high possibility that you will not be able to get a big profit due to the psychological burden.
The center of all trading starts with the average unit price at which you start trading.
If you ignore this, you may be trading in the wrong direction.
Therefore, it is important to find a way to lower the average unit price and adjust the proportion of the investment, ultimately allowing the funds corresponding to the profits to regenerate themselves.
------------------------------------------------------------ -----------------------------------------------------
** All indicators are lagging indicators.
Therefore, it is important to be aware that the indicator moves accordingly with the movement of price and volume.
However, for the sake of convenience, we are talking in reverse for the interpretation of the indicator.
** The wRSI_SR indicator is an indicator created by adding settings and options to the existing Stochastic RSI indicator.
Therefore, the interpretation is the same as the traditional Stochastic RSI indicator. (K, D line -> R, S line)
** The OBV indicator was re-created by applying a formula to the DepthHouse Trading indicator, an indicator disclosed by oh92. (Thanks for this.)
** See support, resistance, and abbreviation points.
** Support or resistance is based on the closing price of the 1D chart.
** All descriptions are for reference only and do not guarantee a profit or loss in investment.
Explanation of abbreviations displayed in the chart
R: A point or section of resistance that requires a response to preserve profits.
S-L: Stop Loss point or section
S: A point or section where you can buy to make a profit as a support point or section.
(Short-term Stop Loss can be said to be a point where profit and loss can be preserved or additional entry can be made through split trading. It is a short-term investment perspective.)
GAP refers to the difference in prices that occurred when the stock market, CME, and BAKKT exchanges were closed because they are not traded 24 hours a day.
G1 : Closing price when closed
G2: Opening price
(Example) Gap (G1-G2)

$CAKE LONGHigher swing high on 4 hour
RR stop and targets marked by green/red shaded zones
Will take 1/2 off at 1st target and let rest ride.

CAKE Break Above 200MABuy the break above 200MA!
The breakout is also supported by the formation of a falling wedge that price has broken out of
Created a trend for price to follow


CAKEUSDSafeMoon (CCC:SAFEMOON-USD) is one of the newest, most interesting and most mysterious altcoins. For some investors, the SafeMoon crypto is also potentially stepping into the shoes of Dogecoin (CCC:DOGE-USD) as the new preferred altcoin.
A close-up shot of the concept for a cryptocurrency exchange page.
Source: PixieMe / Shutterstock.com
SafeMoon launched in March, just a handful of weeks ago. Since then, it has picked up huge momentum on social media. With hundreds of tweets endorsing SafeMoon and pushing for the coin to hit the 1-cent milestone, it is clear the crypto has a serious backing.
The coin is up 2,000% since its initial listing. Many are likening it to DOGE, and some think it’s destined to be the successor to the meme coin. The company is playing up the newfound backing, boasting about being the “most successful crypto” on Twitter and putting out cryptic teasers for fans to speculate on.
The coin is not without controversy, however. SafeMoon has faced its fair share of backlash, and some think that the crypto could be a scam. Speculation from these critics points to the coin being another Bitconnect-type scheme where developers run off with investor money. Others say that the company’s model is a scam in and of itself, as it punishes those who sell their coins.
All this being said, there is still a huge interest in Safemoon.

PancakeSwap (CAKE) - July 18Hello?
Welcome, traders.
If you "follow", you can always get new information quickly.
Please also click "Like".
Have a good day.
-------------------------------------
(CAKEUSD 1W Chart)
If the price holds above the 9.0760290 point, it is expected to maintain an uptrend.
However, since the support section is weak, it is recommended that the price rise above the 16.1961041 point and maintain the price.
(1D chart)
If the price is maintained in the 9.3962999-17.7234416 range, it is expected to turn into an uptrend.
However, if you touch the 9.3962999-10.8786252 section, you have to watch for a sharp rise.
If it falls from the 9.3962999 point, it is expected to enter the mid- to long-term investment area, so you should also think about it.
In order to continue the uptrend, the price must rise above the 20.4991555 point to sustain the price.
-------------------------------------
(CAKEBTC 1W chart)
If the price is maintained above the 26870 satoshi-34500 satoshi range, it is expected that the upward trend will continue.
(1D chart)
If the price is maintained in the 40530 Satoshi-53580 Satoshi section, it is expected that the upward trend will continue.
If it falls from the 40530 satoshi point, it can touch the 20950 satoshi-27480 satoshi section, so Stop Loss is required to preserve profit and loss.
However, since you can touch the 26870 Satoshi-34500 Satoshi section and rise, you should also think about preparing for it.
------------------------------------------
We recommend that you trade with your average unit price.
This is because, if the price is below your average unit price, whether it is in an uptrend or in a downtrend, there is a high possibility that you will not be able to get a big profit due to the psychological burden.
The center of all trading starts with the average unit price at which you start trading.
If you ignore this, you may be trading in the wrong direction.
Therefore, it is important to find a way to lower the average unit price and adjust the proportion of the investment, ultimately allowing the funds corresponding to the profits to regenerate themselves.
------------------------------------------------------------ -----------------------------------------------------
** All indicators are lagging indicators.
Therefore, it is important to be aware that the indicator moves accordingly as price and volume move.
However, for the sake of convenience, we are talking in reverse for the interpretation of the indicator.
** The wRSI_SR indicator is an indicator created by adding settings and options to the existing Stochastic RSI indicator.
Therefore, the interpretation is the same as the traditional Stochastic RSI indicator. (K, D line -> R, S line)
** The OBV indicator was re-created by applying a formula to the DepthHouse Trading indicator, an indicator disclosed by oh92. (Thanks for this.)
** See support, resistance, and abbreviation points.
** Support or resistance is based on the closing price of the 1D chart.
** All descriptions are for reference only and do not guarantee a profit or loss in investment.
Explanation of abbreviations displayed in the chart
R: A point or section of resistance that requires a response to preserve profits.
S-L : Stop Loss point or section
S: A point or section where you can buy to make a profit as a support point or section
(Short-term Stop Loss can be said to be a point where profit and loss can be preserved or additional entry can be made through split trading. It is a short-term investment perspective.)
GAP refers to the difference in prices that occurred when the stock market, CME, and BAKKT exchanges were closed because they are not traded 24 hours a day.
G1 : Closing price when closed
G2: Opening price
(Example) Gap (G1-G2)


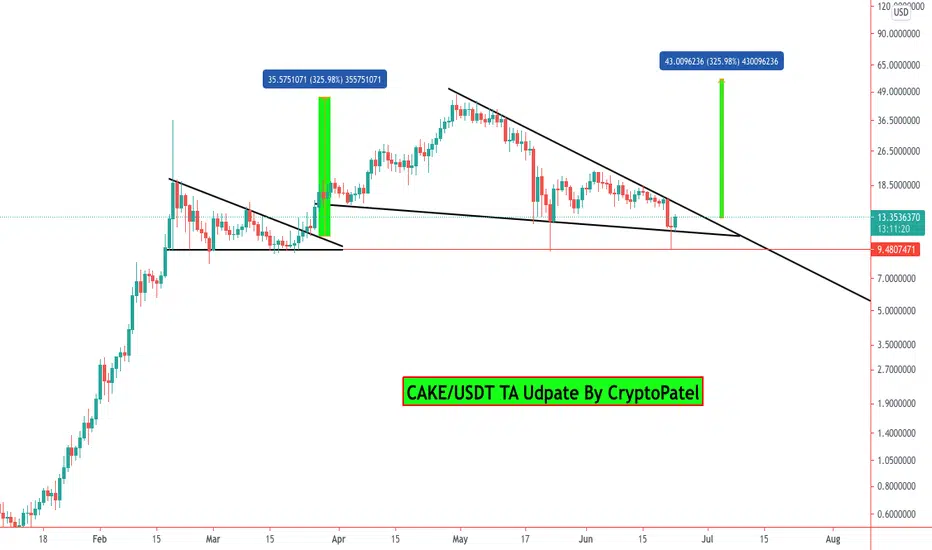
CAKE/USDT Ready for $60 mean 300% from here..?#CAKE/USDT TA Update:
$CAKE looking good at this level.
Yesterday Dumped and Instant recovered.
So I am bullish on $CAKE
Entry:- $11-$13.35
Targets:- $21.50/$27.40/$42/$60
SL:- If candle close below $10.50
Waiting for Breakout.
If break out $16 then Super Bullish.
Support:- $11
Resistance:- $21/$27/$42
Please click like button and Appreciate my hard work.
Must follow me for latest crypto real time updates.
Thank you.
Get ready to make some CAKEGet ready for that buy signal to fire off. I am waiting for a break above trendline (falling wedge pattern potential) for reversal to get more cake at a discount to stake on pancake swap for some APR% $$$.
Who comes up with these defi names? IDK but I like it! Lets trade! Trade safe and have fun!
Message me for charts like this! Taking requests now! and If you want your charts to look like this let me know and ill tell you how!
Like/follow/share!

PancakeSwap (CAKE) - June 14Hello?
Welcome, traders.
By "following", you can always get new information quickly.
Please also click "Like".
Have a good day.
-------------------------------------
(CAKEUSD 1W Chart)
Careful trading is required as the chart has not yet completed a single wave.
Accordingly, it is important to keep the price above the 15.1757179-20.0044522 interval.
(1D chart)
It needs to find support at least at the 17.7234416-20.4991555 range to convert into an uptrend.
If it falls from the 15.1757179 point, you can touch the 9.3962999 point, so you need a Stop Loss to preserve your profit and loss.
This is an important section with several lines passing through the section 15.1757179-20.4991555.
If it climbs in this section, I expect it to touch above the 26.0505834 point.
However, if it does not rise above the 26.0505834 point, it is highly likely that the downtrend will continue, so trade cautiously.
-------------------------------------
(CAKEBTC 1W chart)
Careful trading is required as the chart has not yet completed a single wave.
Accordingly, it is important to keep the price above the 0.0002687-0.0003450 range.
(1D chart)
We'll have to wait and see if we can cross the 0.0004053-0.0005358 section.
In particular, we should see if we can break out of the downtrend line.
If it falls from the 0.0004053 point, a Stop Loss is required to preserve profit and loss.
However, it can touch the 0.0002903 point and move up, so you need to trade cautiously.
------------------------------------------
We recommend that you trade with your average unit price.
This is because, if the price is below your average unit price, whether it is in an uptrend or in a downtrend, there is a high possibility that you will not be able to get a big profit due to psychological burden.
The center of all trading starts with the average unit price at which you start trading.
If you ignore this, you may be trading in the wrong direction.
Therefore, it is important to find a way to lower the average unit price and adjust the proportion of the investment, ultimately allowing the funds corresponding to the profits to regenerate themselves.
------------------------------------------------------------ -----------------------------------------------------
** All indicators are lagging indicators.
Therefore, it is important to be aware that the indicator moves accordingly with the movement of price and volume.
However, for the sake of convenience, we are talking in reverse for the interpretation of the indicator.
** The wRSI_SR indicator is an indicator created by adding settings and options to the existing Stochastic RSI indicator.
Therefore, the interpretation is the same as the traditional Stochastic RSI indicator. (K, D line -> R, S line)
** The OBV indicator was re-created by applying a formula to the DepthHouse Trading indicator, an indicator disclosed by oh92. (Thanks for this.)
** See support, resistance, and abbreviation points.
** Support or resistance is based on the closing price of the 1D chart.
** All descriptions are for reference only and do not guarantee a profit or loss in investment.
Explanation of abbreviations displayed in the chart
R: A point or section of resistance that requires a response to preserve profits.
S-L: Stop Loss point or section
S: A point or section where you can buy to make a profit as a support point or section.
(Short-term Stop Loss can be said to be a point where profit and loss can be preserved or additional entry can be made through split trading. It is a short-term investment perspective.)
GAP refers to the difference in prices that occurred when the stock market, CME, and BAKKT exchanges were closed because they are not traded 24 hours a day.
G1 : Closing price when closed
G2: Opening price
(Example) Gap (G1-G2)


CAKE/USDT : HOW IS IT GOING?Hello fellow traders,
been a while since i did one of these... heres a chart for pancake swap.. i did one some time back & this is just an update if the same chart(see related idea)
if you want to buy more, i suggest you wait till it reaches the second green box so that you can buy more. it seems more like a support zone but NFA.
im long coz btc about to do smthn
Good Luck


CAKE - SCALPLooking for a H12 close within the box, to then look at opening long on a break of that range, for a TP where marked


$CAKEUSD needs a push through $20Simply put, price needs a push through $20 if we want the move to continue. The correction from highs was steep enough for me to think this new range base can round out and give nice support for a move a move back into the 20s/30s.

Inverse Head and Shoulders forming on the CAKE/USD pairIf confirmed I think this is a reasonable target.

PancakeSwap (CAKE) - May 26Hello?
Dear traders, nice to meet you.
By "following" you can always get new information quickly.
Please also click "Like".
Have a good day.
-------------------------------------
(CAKEUSD 1D chart)
We have to see if we can get support in the 17.7234416-20.4991555 range.
In particular, we have to see if we can get off the downtrend line.
In order to turn to an uptrend, it must rise above the 22.7592469 point and gain support.
If it falls below the 11.4213659 point, it can take quite a long time to rise, so you need to trade carefully.
---------------------------------------
(CAKEBTC 1W chart)
(1D chart)
4053 Satoshi-5358 We must watch for any movement that deviates from the Satoshi section.
In particular, it remains to be seen if it can rise along the uptrend line.
We have to see if it can rise above the 5358 Satoshi point in order to turn to an uptrend.
In particular, we have to see if we can get off the downtrend line.
--------------------------------------
It is advisable to trade at your average unit price.
This is because if the price flows below your average unit price, which was on an uptrend or downtrend, there is a high possibility that you will not be able to earn a large profit due to the psychological burden.
The center of every trade starts with the average unit price you start trading.
If you ignore this, you may be trading in the wrong direction.
Therefore, it is important to find a way to lower the average unit price and adjust the proportion of the investment, so that the money that ultimately corresponds to the profit can regenerate the profit.
-------------------------------------------------- -------------------------------------------
** All indicators are lagging indicators.
So, it's important to be aware that the indicator moves accordingly with the movement of price and volume.
Just for the sake of convenience, we are talking upside down for interpretation of the indicators.
** The wRSI_SR indicator is an indicator created by adding settings and options from the existing Stochastic RSI indicator.
Therefore, the interpretation is the same as the conventional stochastic RSI indicator. (K, D line -> R, S line)
** The OBV indicator was re-created by applying a formula to the DepthHouse Trading indicator, an indicator that oh92 disclosed. (Thank you for this.)
** Check support, resistance, and abbreviation points.
** Support or resistance is based on the closing price of the 1D chart.
** All explanations are for reference only and do not guarantee profit or loss on investment.
Explanation of abbreviations displayed on the chart
R: A point or section of resistance that requires a response to preserve profits
S-L: Stop Loss point or section
S: A point or segment that can be bought for profit generation as a support point or segment
(Short-term Stop Loss can be said to be a point where profits and losses can be preserved or additionally entered through installment transactions. It is a short-term investment perspective.
GAP refers to the difference in prices that occurred when the stock market, CME, and BAKKT exchanges were closed because they do not trade 24 hours a day.
G1: Closing price when closed
G2: Market price at the time of opening
(Example) Gap (G1-G2)

Buy Cake LongHere's Pancake swap idea.
What is Pancake swap?
Pancake Swap is the leading decentralized exchange on Binance Smart Chain, with the highest trading volumes in the market.
Market Cap Rank #46
All-Time High $43.96
All-Time Low $0.194441
Next Move expected with another Bull run.
My Entry Targeted Price is $9.1 with TP @$68 to $70.
Stop loss $5
Watching Pancake as a best opportunity.
$100 investment on Pancake: You'll get 10.98 coins. If we hit our target at $70 our profit will be $768.6.
Good Luck.

Cake / USDHuge upside vs Downside
wait for the price action
if break the support look for the buying opportunity
if support hold then look for the pull back

