HSBC eyes on $44.xx: Major Support that could launch next legHSBC dropped into a major support.
Enter here for a scalp or long term.
Nearby resistance for scalp target.
$ 44.76 - 44.91 is the exact support zone.
$ 47.91 - 48.15 is first resistance and TP.
$ 49.86 - 50.16 will be serious, bigger TP.
=====================================
.

Short, target 41.27Following weekly chart.
I got short signals from my 2 indicators.
TP1 41.27
TP2 Purple line, EMA100.
SL - A bit high but technically 44.92 is the stop point.

HSBC "Amazing Opportunity"After the UK CPI came hotter than expected, short positions are shining on the horizon. The UK100(FTSE) index looks over-extended to the bullish side, but better than shorting the index itself is finding a highly correlated with the index position, which in our case is HSBC.
As you can see the peri

HSBC Public Holdings Breakout HSBC Public Holdings idea
Nice and clean Breakout of HSBC , retesting of support line is another opportunity from the nearest top

M&S & HSBC UK Collaborate to Elevate Digital Banking ExperienceIn a dynamic move to cater to evolving consumer demands, UK retailer Marks and Spencer (M&S) has cemented a new seven-year partnership with NYSE:HSBC UK, aimed at revolutionizing the credit and digital payment landscape through its banking arm, M&S Bank.
The collaboration signifies a strategic sh

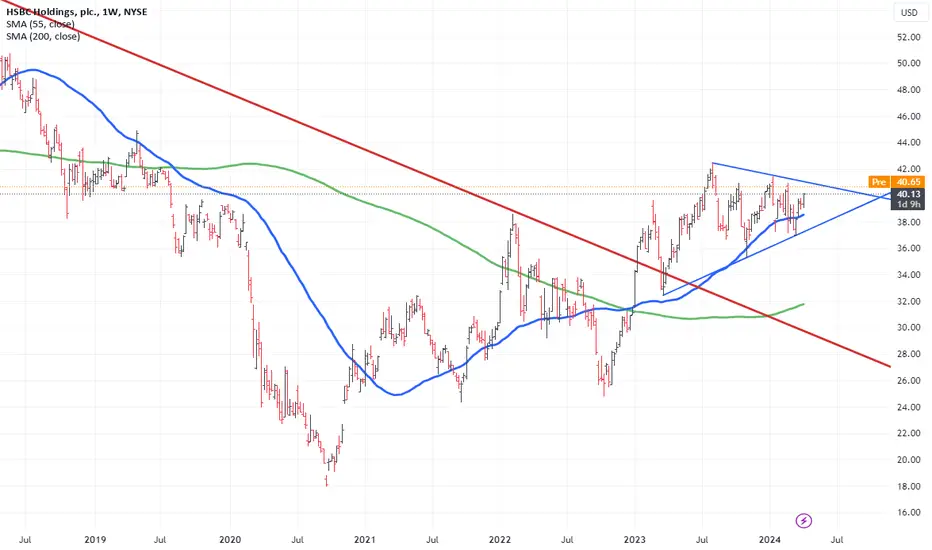
Potential Symmetrical triangle?I find the chart on HSBC interesting. Last year, we witnessed the market break a significant downtrend that had been in place since 2007. Currently, it appears we are on the verge of completing a symmetrical triangle pattern. Considering the market's support from its 200-week moving average and the
HSBS Investment Conservative Trend Trade 7FConservative Trend Trade 7F
+ long impulse
+ 1/2 correction
+ T2 level
+ support level
+ biggest volume 2Sp+
Monthly Context:
+ long impulse
+ SOS level
+ 1/2 correction
+ support level
+ 2Sp- + test"

HSBC Day to Investment Conservative Trend TradeConservative Trend trade 7F
+ long balance
+ ICE level
- support level
+ 1/2 correction
+ biggest volume 2Sp+
Calculated affordable virtual stop loss
Take profit:
+ 25% 1/2 R/R
+ 75% T1 of Monthly
Hourly Context
+ long impulse
Daily Context:
+ long impulse
+ 1/2 correction
+ T2 level
+ support

HSBC (NYSE: HSBC) Launches $150m Venture Debt ProductHSBC is introducing a venture debt offering in Australia to help scale-up companies that might otherwise struggle to attract more traditional forms of funding to achieve new growth.
Launching this month, the bank has allocated $150 million (AUD 227 million) to lend between $6.6 million and $19.8 mi

HSBC Holdings PLC, week#41As long as it's price above $39.37
HSBC will reach $52.61, potentially.
The only problem is, it's volume didn't show a great signal, yet

See all ideas
Displays a symbol's price movements over previous years to identify recurring trends.