$BABA - Possible upside to the next target areaNYSE:BABA It looks like a successful neckline checkback. There’s a chance it could head toward the second and third targets soon.
The second target area of $88 to $90 is a strong resistance and might be challenging to break.
I’m guessing that NASDAQ:PDD can no longer engage in cutthroat price wars or endless promotions and might be losing market share to $BABA.
With China starting to ease its grip on tech companies, Ant Group might finally go public sometime in the future.
See Aug 14 post for price targets.
As always, I share my opinions and trades. I’m not suggesting anyone follow my trades. You do you.
9988 trade ideas

Alibaba Spike 4% After Completing Three-Year Regulatory OverhaulOverview
Alibaba Group Holding Ltd. (NYSE: NYSE:BABA ) saw its stock jump 4% in premarket trading following the completion of a rigorous three-year regulatory overhaul mandated by China’s State Administration for Market Regulation (SAMR). This milestone marks a significant turning point for Alibaba, as it moves past one of its most challenging periods and signals potential new growth opportunities for investors.
Regulatory Milestone:
The completion of Alibaba’s regulatory rectification process comes after the company was hit with an antitrust fine of 18.23 billion yuan ($2.6 billion) in 2021. The fine was a result of practices deemed monopolistic, specifically the “choose one of two” policy, which forced merchants to commit to one e-commerce platform over another. Over the past three years, SAMR has supervised Alibaba’s compliance efforts, culminating in the cessation of these monopolistic behaviors. The regulator’s announcement of “effective results” underscores Alibaba’s adherence to new operational standards and improved market practices.
Fundamental Analysis:
This regulatory approval is more than just a relief for Alibaba (NYSE: NYSE:BABA )—it represents a potential catalyst for renewed investor confidence and market performance. The removal of regulatory constraints opens the door for Alibaba to refocus on growth strategies and innovation. Despite facing significant scrutiny and a dramatic 70% decline in stock value since its peak in 2020, Alibaba has shown early signs of recovery. The June quarter results revealed a rebound in cloud computing revenue and robust e-commerce transactions, reflecting a positive trend in the company’s operational performance.
Technical Analysis:
From a technical standpoint, Alibaba’s stock is positioned for a potential bullish trend. The recent 4% surge in premarket trading is indicative of strong market sentiment and investor optimism. The stock is currently exhibiting a gap-up pattern, as there were no trading activities leading up to this surge. The Relative Strength Index (RSI) sits at 52, suggesting that the stock is neither overbought nor oversold. This neutral RSI position is favorable for further growth, provided buying momentum continues.
Future Outlook:
The completion of the regulatory overhaul represents a “new beginning” for Alibaba, according to the company’s statement. The focus will now shift towards innovation and enhancing compliance, with a strategic emphasis on technology investment and promoting a healthy platform economy. The endorsement from SAMR could also signal a broader softening stance from Chinese regulators towards the tech sector, which has been under intense scrutiny since late 2020.
However, challenges remain. The broader tech industry continues to grapple with cautious consumer spending and a slower funding environment for startups. Alibaba’s path to sustained growth will depend on its ability to leverage this regulatory victory into tangible business outcomes and maintain momentum in a competitive market.
Conclusion:
Alibaba’s completion of its regulatory overhaul is a pivotal moment for the company, offering both technical and fundamental reasons for optimism. The stock’s recent surge reflects renewed investor confidence, while technical indicators suggest potential for further gains. As Alibaba transitions into this new phase, stakeholders will be watching closely to see how the company capitalizes on its regulatory victory to drive future growth and innovation.
Investors should remain vigilant and monitor upcoming earnings reports and market trends to gauge Alibaba’s ability to sustain its recovery and capitalize on its renewed operational freedom.

Alibaba Group Holding Limited (BABA) Stock Forecast The labels that are used are ment to draft and measure context to the price action involved and contain no rules-engaged notebook + applied-set up indicators, but an avoiding interference to use other rules-engaged software to enhance in general, regarding to the watchlist and trade plan that is relevant to trade-on
Within a 100K account balance the split on trade & risk management = 1/10% - 1/20% margin as an execution range, to set up an order entry and select a per trade on average, to avoid any drawdown hit regarding to the stop loss & to execute risk on management specifics. Trail stop efforts are a focus of attention to the set up in general when volatile-price-action is involved, mainly because of the usage of an intraday-scalp-position tool on behalf on the trade plan in general
Key indicators on Trade Set Up in general;
1. Push Set Up
2. Range Set Up
3. Break & Retest Set Up
Active Sessions on Relevant Range & Elemented Probabilities;
* Asian(Ranging) - London(Upwards) - NYC(Downwards)
* Weekend Crypto Session
# TREND | TIME FRAME CONDUCTIVE | Daily Time Frame
- General Trend
- Measurement On Session
* Signpost
* Support & Resistance
* Trade Area | Focus & Motion ahead
# POSITION & Risk Reward | 15 Minutes Time Frame
- Measurement On Session
* Retracement | 0.5 & 0.618
* Extension | 0.88 & 1
Conclusion | Trade Plan Execution & Risk Management on Demand;
Alibaba Group Holding Limited (BABA): Overall Consensus | Neutral

BABA: Time for International MarketsWith the announcements of upcoming federal funds rate cuts the dollar should start to weaken over time. Over the last 5 years there has been a negative correlation between the DXY and ICEUS:MFS1! which tracks the global equity market.
While China is not a significant holding of this particular index, it should benefit from a lower dollar as well.
Additionally NYSE:BABA we can see that BABA is on the verge of breaking out of its 2 year downtrend.
Upside Target $160
Entry: $85.50
Stop Loss: (10%)

All hail $BABAAlibaba showing massive deep value return on the MONTHLY.
Patience will be rewarded.
#BABA

BABA to comeback to Create Double Top! Buy 8/21/24 - 8/28/24BABA is moving within a wide and horizontal trend and further movements within this trend can be expected. Given the current horizontal trend, you can expect Alibaba stock with a 90% probability to be traded between $73.00 and $84.62 at the end of this 3-month period. A break of a horizontal trend is often followed by a large increase in the volume, and stocks seldom manage to go directly from the bottom of a trend up to the top. Stocks turning up in the middle of a horizontal trend are therefore considered to be potential runners.
If Entered will be at 83.15 -83.35

BABA Alibaba Group Holding Limited Options Ahead of EarningsIf you haven`t bought the dip on BABA:
Now analyzing the options chain and the chart patterns of BABA Alibaba Group Holding Limited prior to the earnings report this week,
I would consider purchasing the 85usd strike price Calls with
an expiration date of 2024-9-20,
for a premium of approximately $2.38.
If these options prove to be profitable prior to the earnings release, I would sell at least half of them.

BABA hitting upper resistance - will it break out? BABA starting to upturn? Wait for it to break out to confirm bullish uptrend

$BABA Strengthening If we can get above the quarterly upper band and close. We have a real good shot at hitting the highs of $116 again.
BABA looks very bullish on the monthly and weekly charts.
We have a broken falling wedge, with a new higher high break out, with a pullback to test the back side of the main down trend and are rising back to the most recent highs. If we can close strongly in the next week or 2, I think BABA, JD, and BIDU and all going higher.

Ali Baba GroupAlibaba shares hit a low today, which also formed a strong support zone in this area. It is a good opportunity for long-term investment.

Alibaba Potential Downtrend Breakout At $81.26 16.08.2024Apply risk management
Risk Warning: Trading in CFDs is highly speculative and carries a high level of risk. It is possible to lose all of your invested capital. These products may not be suitable for everyone, and you should ensure that you fully understand the risks taking into consideration your investment objectives, level of experience, personal circumstances as well as personal resources. Speculate only with funds that you can afford to lose. Seek independent advice if necessary. Please refer to our Risk Disclosure.
BDSwiss is a trading name of BDS Markets and BDS Ltd.
BDS Markets is a company incorporated under the laws of the Republic of Mauritius and is authorized and regulated by the Financial Services Commission of Mauritius ( FSC ) under license number C116016172, address: 6th Floor, Tower 1, Nexteracom Building 72201 Ebene.
BDS Ltd is authorized and regulated by the Financial Services Authority Seychelles (FSA) under license number SD047, address: Suite 3, Global Village, Jivan’s Complex, Mont Fleuri, Mahe, Seychelles. Payment transactions are managed by BDS Markets (Registration number: 143350)
Disclaimer

Alibaba (NYSE: $BABA) Misses First-Quarter Revenue EstimatesAlibaba Group Holding Ltd. (BABA), China’s e-commerce giant, faced a challenging second quarter in 2024, as reflected in its earnings report that missed market expectations. The company, which has been navigating a complex economic landscape marked by rising competition and cautious consumer behavior, saw its shares dip nearly 4% in premarket trading following the disappointing results.
Key Financials and Earnings Miss
For the quarter ending June 30, 2024, Alibaba ( NYSE:BABA ) reported revenue of 243.24 billion Chinese yuan ($34.01 billion), falling short of the 249.05 billion yuan expected by analysts. Net income also took a hit, dropping 29% year-over-year to 24.27 billion yuan, compared to the 26.91 billion yuan expected.
The revenue increase of 4% year-on-year was overshadowed by the significant drop in net income, which the company attributed to a decline in income from operations and an increase in impairments from its investments.
Challenges in Core E-commerce Business
Alibaba's core China e-commerce business, which has been the bedrock of the company’s success, continued to face headwinds. Sales from the Taobao and Tmall group, representing Alibaba’s domestic e-commerce segment, fell by 1% year-over-year to 113.37 billion yuan. Despite efforts by CEO Eddie Wu to stabilize and rejuvenate this segment, the company is struggling against a backdrop of increased competition from rivals like JD.com and Temu’s parent company PDD Holdings.
The Chinese consumer market, which has been slow to recover from the economic downturn and high job insecurity, further exacerbates Alibaba’s challenges. Although Alibaba reported “double-digit” growth in gross merchandise value (GMV) within its Taobao and Tmall platforms, this was not enough to offset the overall revenue decline.
Global and Cloud Segments Show Promise
While the domestic market remains challenging, Alibaba's international e-commerce division offered a bright spot. Revenue in this segment grew by 32% year-over-year, driven by strong performances from platforms like Lazada and Aliexpress. This growth reflects Alibaba’s strategic focus on expanding its global footprint and catering to the increasing global demand for affordable Chinese goods.
The company’s cloud computing division also demonstrated resilience, with revenue rising 6% year-over-year to 26.5 billion yuan. This marked the fastest growth rate for the cloud segment since Q2 2022. Alibaba’s cloud unit, which has been a focal point for future growth, benefited from its investments in artificial intelligence (AI) and the introduction of new AI-related products. The cloud division’s adjusted earnings before interest, taxes, and amortization (EBITA) soared by 155% year-over-year, highlighting improved operating efficiency and a focus on higher-margin contracts.
Strategic Shifts and Future Outlook
Alibaba ( NYSE:BABA ) has been undergoing significant structural changes since 2023, including a major corporate overhaul that split the company into six business units. CEO Eddie Wu, who took over leadership in September, has been keen on refocusing the company’s strategy, particularly within its core e-commerce business. This includes reducing reliance on direct sales and enhancing monetization features for third-party merchants on Taobao and Tmall.
Wu has set ambitious goals to return the Taobao and Tmall businesses to growth by late 2025, with new monetization strategies expected to play a crucial role. However, the company remains in a transition phase, and the effectiveness of these strategies will be closely watched by investors and analysts alike.
Technical Outlook
In the premarket trading session on Thursday, Alibaba's (NYSE: NYSE:BABA ) stock experienced a decline of 3.57%. The daily price chart reveals the presence of a bearish hanging man candlestick pattern. However, it is noteworthy that the Relative Strength Index (RSI) stands at 55.80, implying a neutral position that neither indicates oversold nor overbought conditions. Furthermore, the Moving Average Convergence Divergence (MACD) indicator value of 0.284 suggests a bullish trend, supporting a favorable outlook.
A notable observation is the convergence of all moving averages (MA) at a singular point. This pattern often signals a potential shift in trend or a phase of consolidation in the market. Such convergence may signify market indecision, with equilibrium between buyers and sellers. Depending on various factors such as the positions of short-term and long-term moving averages, this signal may hint at an impending breakout in the market. Traders are advised to seek confirmation from price action or additional indicators before making substantial decisions.
Conclusion
Alibaba's Q2 2024 earnings report underscores the challenges the company faces in a rapidly evolving and competitive market. While the company's international and cloud segments show promise, the core e-commerce business in China continues to grapple with significant obstacles. CEO Eddie Wu’s efforts to stabilize and revitalize this segment will be critical to Alibaba’s future performance, particularly as the company navigates through its ongoing transformation.
Investors will be keen to see how Alibaba’s strategic shifts play out over the coming quarters, particularly in light of the intense competition and economic uncertainty that continue to cloud the Chinese market.

Alibaba Group Downtrend Line Rejection At $81.30 15.08.2024Apply risk management
Risk Warning: Trading in CFDs is highly speculative and carries a high level of risk. It is possible to lose all of your invested capital. These products may not be suitable for everyone, and you should ensure that you fully understand the risks taking into consideration your investment objectives, level of experience, personal circumstances as well as personal resources. Speculate only with funds that you can afford to lose. Seek independent advice if necessary. Please refer to our Risk Disclosure.
BDSwiss is a trading name of BDS Markets and BDS Ltd.
BDS Markets is a company incorporated under the laws of the Republic of Mauritius and is authorized and regulated by the Financial Services Commission of Mauritius ( FSC ) under license number C116016172, address: 6th Floor, Tower 1, Nexteracom Building 72201 Ebene.
BDS Ltd is authorized and regulated by the Financial Services Authority Seychelles (FSA) under license number SD047, address: Suite 3, Global Village, Jivan’s Complex, Mont Fleuri, Mahe, Seychelles. Payment transactions are managed by BDS Markets (Registration number: 143350)
Disclaimer
$BABA - It all depends on ER tomorrow morningNYSE:BABA Alibaba is reporting tomorrow morning. It's make or break for the cup and handle pattern. A full measured move for the cup and handle breakout is $87.
Targets:
$84
$87
$90
Support:
$77

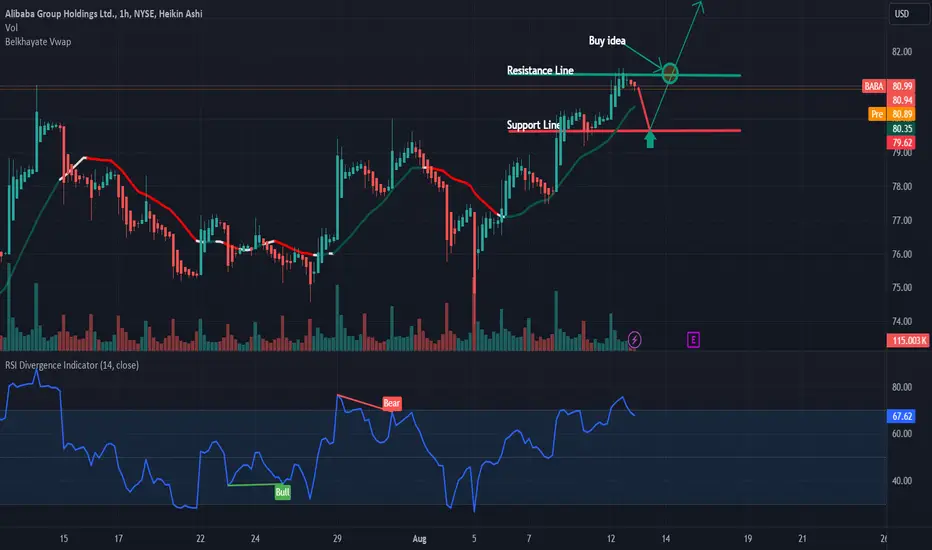
BABA: Buy ideaOn BABA we would have a hight probability to have an uptrend if only if we have the breakout with force the resistance line by a big green candle follow by a large green volume!
Alibaba Group (BABA) Stock Reaches Over Two-Month HighAlibaba Group (BABA) Stock Reaches Over Two-Month High
As shown on the BABA stock chart, the price today has risen to around $80.80—its highest level this summer.
The primary driver of bullish sentiment is the anticipation of a positive earnings report from Alibaba Group Holding Ltd for Q2 2024, set to be released on 15th August.
According to Dow Jones Newswires:
→ Lazada, a subsidiary of Alibaba Group, has reached a certain level of profitability, which is a promising sign for the tech giant as it seeks to boost international sales amid slowing growth in China.
→ Alibaba’s market share has stabilised after a decline in 2021. DBS analysts Sachin Mittal and Andy Yeo note that the Gross Merchandise Value (GMV) of goods sold on Taobao and Tmall has returned to double-digit growth, and Alibaba’s international e-commerce platforms could become a key driver, with an estimated compound annual growth rate of 23% from FY2024 to FY2027. DBS maintains its buy recommendation for Alibaba shares.
Technical analysis of the Alibaba (BABA) stock chart shows that:
→ The price is forming an ascending channel (shown in blue) and has already risen to its median line. However, it remains under pressure from a descending trendline that has been in place since 2023.
→ The chart shows patterns of false breakouts (marked with arrows) of previous local highs. It’s possible that a similar pattern (with a return below the psychological level of $80.00) could occur before the report is released.
Be prepared for sharp movements in Alibaba Group (BABA) stock around the time of the report’s publication. It could either meet bullish expectations or deliver a bearish surprise.
This article represents the opinion of the Companies operating under the FXOpen brand only. It is not to be construed as an offer, solicitation, or recommendation with respect to products and services provided by the Companies operating under the FXOpen brand, nor is it to be considered financial advice.

Baba coming out of the cloudIt seems baba is coming out of the cloud. huge buy signal if they beat earnings. I don't think there will be a retracement this time..Time to buy calls.

$BABA volatility pricing skew on CALL side before earningsThe high vertical CALL pricing skew on the options chain shows that the CALL options for the September expiration are already much more expensive than the PUT options at the same expected move distance. This suggests that market participants are pricing in an upward move.
Let's take a closer look at the probability curve formed by the options chain. I'm very curious to see whether the 8/8 to +1/8 quadrant line will hold the price for BABA, or if it will continue to surge into the Upper Extreme quadrant, heading towards +4/8 until $100.
If everything stays the same, something like this could be an interesting lottery ticket for me. I'm thinking about an OTM call butterfly with a short expiration before earnings.
I have to admit, I’m not a big fan of risking on this red/black roulette type of play, but if things stay as they are, I might consider combining it with a 40 or 68DTE credit put ratio below and the call butterfly above before earnings.
But we'll see how things look on the day before earnings!

$BABA | Allocation & Watchlist | Market Exec & Buy Stops |Technical Confluences:
- Price action has been consolidating between a Wedge pattern
- Price action is at a Demand Zone of all-time lows
- Price is starting to slowly break above the 200MA
- A break above the resistance trendline (been a good support/resistance TL) would be a significant move.
Fundamental Confluences:
- Considerably cheap valuations
- Still one of the largest e-commerce players, don't see it dropping it off anytime soon
- China's economy has been weakening and we are seeing efforts by the China government to help boost back the domestic economy. Potential for revenue boost.
________________________________
Putting in my first tranche of NYSE:BABA allocation for my Long-Term portfolio.
Gonna be holding this share for years and will continue adding position with Buy Stop orders.
Remember, DYOR.
________________________________
Boosts 🚀, Follows ✌️, Shares 🙌 & Comments ✍️ are much appreciated!
If you have any ideas or charts, do share them in the 'Comments' section below and we can discuss our perspectives to improve or strengthen our strategies.
If you want something analyzed, do drop me a DM. :D
________________________________
Disclaimer: The above suggestion is an personal opinion in general and does not constitute as investment advice. Any decisions taken based on the above suggestion is purely your own risks. DYOR.

Huge discount on AlibabaAUGUST 2016:
Share Price: $79
Revenue: $5 Billion
Cash: $16 Billion
AUGUST 2024:
Share Price: $79
Revenue: $31 Billion
Cash: $83 Billion
target $151

Baba Batting SceneLevel of confidence for this simulation is below 31% but it could go up in case intriguing hits and inflections happen near the dots. Overall my points of interest are the potential numbered inflection points. Time stamp and or price level would suffice regardless of the deviations, but in order to consider any of these setups as potent or viable or to have a decent amount of probable mathematical advantage, we first need to see how we get there and how it looks when it lands in any of the potential setups.
Also, there should be some interest in the potential big blue zone of influence but as mentioned, I am more interested to see if Baba bats and hits the dots and sends it on the developed path or at least on one wave out of all of them.

BABA SHORTfailed to maintain the line after it dipped once ! the second dip it's over it's officially weak and we could short it

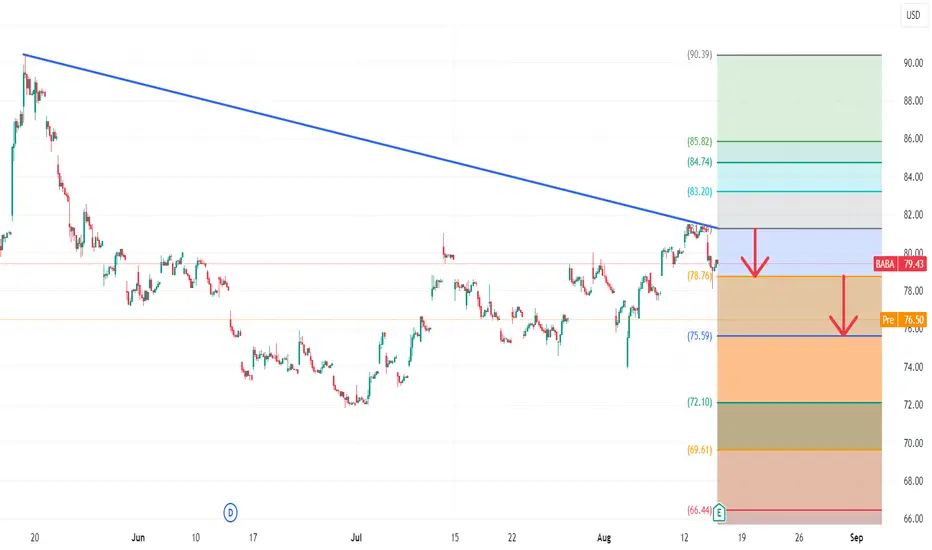
Anti Bat Bearish Harmonic Pattern on BABA🔍 Overview:
I've identified an Anti Bat bearish harmonic pattern on BABA stock, and it's looking promising for a short trade on the 3-hour chart! 📉
📉 Chart Analysis:
1️⃣ The Anti Bat pattern suggests a potential downward move, with resistance around the $78.13 level.
2️⃣ If we hit $78.13, a Shark bearish pattern also begins, providing additional confirmation for the bearish sentiment. 📈
🎯 Trade Setup:
Anti Bat Pattern:
Target 1: $77.91 💰
Target 2: $73.73 💸
SL: $81.55
Shark Pattern (if $78.13 is hit):
Target 1: $76.02
Target 2: $72.22
📝 Why I'm Interested:
The combination of the Anti Bat and potential Shark patterns strengthens the bearish outlook. 📊📉 These patterns often signal high-probability reversals, and with the confirmation of the Shark pattern, this trade setup becomes even more compelling.
📅 Timeframe: Watching this setup on a 3-hour chart, so keep an eye on shorter-term price movements for the best entries and exits. ⏳
🔔 Stay Updated: Be ready to adapt your strategy as the price action unfolds. Let's get it! 🤑💪🏻
#BABA #AntiBatPattern #SharkPattern #HarmonicPatterns #Trading #StockMarket #TechnicalAnalysis #TradeTalkFarsi 📉🐻
