BABA - How About A Collar Trade?The green zone is long term support.
The Pitchfork projects path of price, on a Pendulum Swing basis.
The sliding parallel (white) marks the overshoot and projected support.
As we see, the steep down sloping yellow dotted resistance line was broken 5 weeks ago. But that's no reason to rush in. Why not wait for more facts?
Do we have facts now?
Yes, we have.
a) support at the sliding
b) today we see a close above the last high AND a break of the (grey horizontal) resistance.
How can we play this with low risk?
What about a Collar?
1. Buy Stock
2. Buy Put ATM
Optional:
- sell a longer dated Call (potentially limiting stock profit to finance the put)
- sell lesser Calls, to let the rest of the stock position ride, if price close ITM and calls away your (partial) position.
That's just an idea how to play it save.
Why save? What if BABA tanks?
- sell Put profit and buy more stocks to bring down the cost basis. Repeat until B/E or in profit. Additionally you can sell more Calls if they are above calculated cost basis.
Highest Risk: If the stock go to zero, then the initial investment of stocks is gone. Could it happen? Yes. High chance of happening? Don't think so.
Would love any input about this idea.
Happy weekend §8-)
9988 trade ideas

BABA AnalysisPrice playing nicely according to my last analysis, giving us a 11.78% move to the upside, taking liquidity below the lows at 83.24. With the current bullish momentum, potential target for this up move should be to take the liquidity above 105.05, unless the current bearish POI holds, then we can expect a bearish retracement into the fair value gap at 86.63.

ALIBABA Expectations for strong bounce back.
#BABA looks strong here, It's possible to see big pump in next 1-2y.
This is not a financial advice.

Alibaba is in a good position to buyAccording to Elliott Waves, Alibaba is in a good position to enter.
The first target is $160
The second target is $250

Alibaba (BABA) ST PT: $105According TipRanks, the average price target for Alibaba is $141.73. This is based on 15 Wall Streets Analysts 12-month price targets, issued in the past 3 months. The highest analyst price target is $181.00 ,the lowest forecast is $98.00. The average price target represents 70.04% Increase from the current price of $83.35.

FrogAlgo: What is 0DTE Option?🔔 Trading zero-day-to-expiration (0DTE) options on AMEX:SPY has both positive and negative aspects. Let's explore them 🧵:
Positive:
♻️ High Potential for Quick Profits: 0DTE options offer the opportunity for rapid gains if the underlying stock, in this case, AMEX:SPY , experiences a significant price move within a single trading session.
♻️ Reduced Time Decay: As the options approach expiration, their time value diminishes rapidly. This can work in favor of traders, as time decay accelerates, potentially increasing the profitability of the trade.
♻️ Flexibility: 0DTE options allow traders to capitalize on short-term price fluctuations in AMEX:SPY without committing to longer-term positions. This flexibility can be advantageous for those seeking quick, opportunistic trades.
Negative:
♻️ High Risk: 0DTE options carry substantial risk due to their short expiration timeframe. The price of AMEX:SPY must move significantly and in the desired direction within the trading session for the trade to be profitable. Otherwise, the options could expire worthless, resulting in a complete loss of the investment.
♻️ Increased Sensitivity to Market Volatility: 0DTE options are highly sensitive to changes in market volatility. Rapid shifts in AMEX:SPY 's price can cause dramatic swings in the option's value, amplifying both gains and losses.
♻️ Limited Time for Adjustments: With 0DTE options, there is minimal time available to react and make adjustments if the trade goes against expectations. Traders must be prepared to act quickly and decisively.
🔔 It's crucial for traders to thoroughly understand these factors and assess their risk tolerance before engaging in 0DTE option trading on AMEX:SPY or any other underlying asset.

$100+ magnet Alibaba (BABA) Alibaba (BABA) has a had a great week so far after making a higher low. The volume has been decent last three days. Future targets are $120, $140, $160. Look for continuation move to the upside with a target of $102-105 before a major pullback. Massive inverse head and shoulders pattern intact. The Hang Seng Index appears to be bottoming. Expect more stimulus during this deflationary period. The regulatory environment is improving for Chinese tech companies. Therefore, I think Chinese tech will outperform the S&P and QQQ for the remaining part of the year.
Disclaimer: I am not a financial advisor and this is not financial advise. This is only for educational purposes.

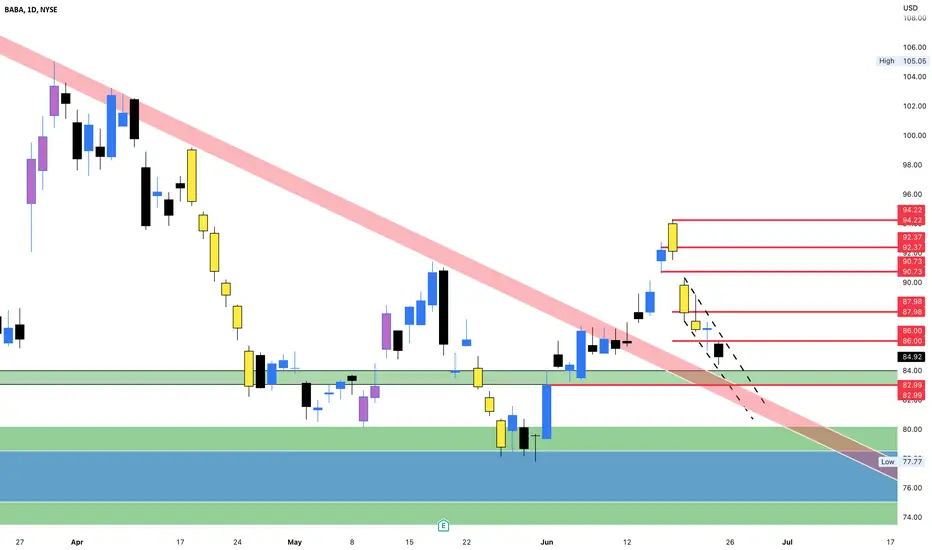
BABA short term bullish swing idea On Friday June 16th, BABA hit a daily supply area following a CHOCH on the daily as well as a breakout of a longterm down trend that began back on January 26th. BABA has since retraced into the fib golden zone (50%-61.8%). It is currently sitting on a support between 83.04 and 83.99. BABA’s price action on the daily also seems to be creating a smaller inverted head and shoulders pattern within the right shoulder of the larger head and shoulders forming on the weekly/monthly charts. Watch for price to hold this level at 83.04 and 83.99. Wait for the daily candles to start making a new high (above 86.00). Also note that the price of the previous 4 daily candles are trading within a descending channel. Drop to lower time frames (30m/1h/4h) to find a precise entry after the breakout of the descending channel and a structural change in price.
Targets: 87.98, 90.73, 92.37, 94.22
Stop: 82.98 or a break and hold below the current support between 83.04 and 83.99. ***** If price price does fail to hold watch for a retest of support turned resistance for an entry to the downside with targets of (78.10-78.83). OR watch for a reclaim of the broken support*****
Alibaba's (BABA:NYSE) Stock Outlook: Potential BoostIntroduction:
Alibaba, the Chinese multinational conglomerate, has experienced difficulty in breaking out of its trading range between $80 and $90. However, recent developments in China's economy and the resolution of Ant Group's fine have the potential to provide a significant boost to the company's stock.
Ramping Up Buybacks:
In a bid to enhance shareholder value, Alibaba has intensified its buyback efforts. Notably, the company has disclosed that it repurchased a larger volume of stock between April 1 and May 17 than in the entire preceding quarter. This proactive approach demonstrates Alibaba's commitment to bolstering investor confidence and indicates management's belief in the company's long-term prospects.
Positive Catalysts:
Alibaba's stock value has faced the risk of potential U.S./China tensions, which could adversely impact the company's shareholders. However, several positive catalysts contribute to Alibaba's attractiveness as an investment option, positioning it as a bargain when compared to other alternatives in the market.
China's Economic Developments:
The recent developments in China's economy offer promising prospects for Alibaba's stock. As the Chinese economy recovers and displays signs of resilience, Alibaba stands to benefit from increased consumer spending, expanding middle-class demographics, and rising e-commerce penetration. These factors create a favorable environment for Alibaba to grow its revenue and solidify its market position.
Resolution of Ant Group's Fine:
The resolution of the regulatory issues faced by Ant Group, an affiliate of Alibaba, is another positive development for the company. The resolution brings clarity and reduces uncertainties surrounding Alibaba's operations. With a more stable regulatory landscape, Alibaba can focus on its core business activities and pursue growth opportunities with greater confidence.
Conclusion:
While Alibaba's stock has struggled to break free from its trading range, recent developments in China's economy and the resolution of Ant Group's fine have the potential to provide a significant boost. Furthermore, Alibaba's proactive buyback strategy, combined with its attractive valuation and positive catalysts, make it an appealing investment option compared to other choices in the market. As investors assess the evolving landscape, Alibaba's potential for growth and resilience in the face of challenges should not be overlooked.
This content is provided for general information purposes only and is not to be taken as investment advice nor as a recommendation for any security, investment strategy or investment account.

BABA: Sell ideaSell idea on BABA as you see on the chart because we have the breakout with force the vwap by the sellers.Thanks.
$BABA - July 10 , Gameplan! NYSE:BABA - On Friday, the Alibaba stock price experienced a significant gain of 8.00%, rising from $83.84 to $90.55. Throughout the trading day, the stock fluctuated by 5.69%, reaching a low of $86.64 and a high of $91.57. Over the past 2 weeks, the stock has shown some volatility, resulting in a 4.21% gain. Volume increased on the last day, aligning with the price increase, which is viewed as a positive technical sign. In total, 34 million more shares were traded compared to the previous day, with a total of 47 million shares bought and sold, totaling approximately $4.21 billion. Currently, the stock is positioned in the upper range of a wide and falling trend in the short term, suggesting a potential selling opportunity for short-term traders as a reaction towards the lower part of the trend may be expected. A breakthrough above the top trend line at $90.73 would indicate a slower falling rate and could be a sign of a potential trend shift. Based on the current short-term trend, it is anticipated that the stock will experience a -6.58% decline over the next 3 months. There is a 90% probability that the stock will reach a price range between $70.94 and $84.76 at the end of this 3-month period. It's important to note that if the stock manages to maintain or exceed its current levels, the predictions may change positively in the coming days as the conditions for the current projections would be broken. Additionally, Ant Group, co-founded by Jack Ma along with Alibaba Group, announced a share buyback valued at $78.5 billion, significantly lower than its valuation before its IPO was halted by Chinese regulators three years ago. The combined market capitalization loss for Ant and Alibaba reaches approximately $877 billion, calculated based on peak share prices recorded in late October 2020, around the time when Jack Ma criticized Chinese financial regulators and banks in a notable speech.

ALIBABA BULLISH VIEW !!!This could either proceed to form an inverted Head&Shoulder, or go upto resistance and form another lower leg while taking support from the trendline.
Happy Trading !!!

ALIBABA broke above the yearly Resistance. Buy signal.Alibaba broke on Friday above the Falling Resistance that was initiated on January 26th.
That was also a crossing over the 0.236 Fibonacci level.
Technically that is a strong double bullish break out for a potential long term bullish reversal.
Trading Plan:
1. Buy on the current market price.
Targets:
1. 105.00 (Resistance 2 and Fibonacci 0.618) and 120.00 (Resistance 3 and Fibonacci 1.000).
Tips:
1. The RSI (1d) has been on a Rising Support since March 10th. A Bullish Divergence and clear sign of a long term bullish reversal.
Please like, follow and comment!!

BABA: Exclusively for long-term investorsAlibaba is in a broad channel of consolidation that could take quite a long time to break. A great opportunity to start shopping below $70, looking ahead for several years. The last accumulation cycle took ~970 days, but this does not mean that there will be something similar now, but it is obvious that the patient ones will win. Below I will attach a picture of the previous accumulation cycle, which had a similar wide channel.
All good deals and profit✅ Not a recommendation for action.


$BABA - Is this time for real?NYSE:BABA finally! waking up! Targets unchanged from June 7th post below. It formed a mini IHS inside a big IHS!!! How cool is that?
IHS - Inverse Head and Shoulder.
💥🚀💰
Targets - $99, $112, $124
Downside risk - $78

BABA Reversal Divergence - Micro Update!Hey Folks!
The reversal divergence seen on a 4hr tells me all I need to know for now, seems a matter of time. Not to mention a healthy micro Inverse Head and Shoulder and a Cup and Handle, just like the Macro chart. Fractal patterns are a powerful signal in my experience, especially with bullish divergence.
I would expect some kind of note worthy fundamental catalyst soon. Patterns like these shouldn't go to waste lol
Happy Trading and I hope this helps anyone!
OnePath


BABA Long CallBuy NYSE:BABA Jul-14-23 95 Calls @ 0.26 Limit to Open
Long call expires the following week. Cheap entry and good upside. Price seems to bounce off an important zone on various timeframes.

Baba for final leg down Upon a break of the desending triangle, i anticipate baba to reach 40 ish dollars.
This will be as the rest of the market pukes as well. I am ready for this once in a life time opportunity should it play out.
I will not short these levels, as were already in the basement, but I will wait in cash.

BABA LONG - Breakout of falling wedge
Many people have shared analyses online of BABA having formed a descending triangle since January, which was used as a bear case for BABA falling to a new all time low, or making a double bottom before starting it's next bull run.
If you look at the chart I've shared you'll see an alternative analysis, with a trend line acting the the bottom of a falling wedge pattern (that the stock broke out of to the upside last week), which has significance as support and resistance going all the way back to Oct 2021.
WHITE LINE = Inverse H&S Neckline
ORANGE LINES = Height of the Inverse H&S, and subsequent breakout move of an equal height
PURPLE LINES = Height of the falling wedge, and subsequent breakout move of an equal height
YELLOW LINES = top trend lines of 2 separate falling wedge patterns that occurred in 2022, and the most recent from January to June 2023
**PINK LINES = bottom trend lines of the falling wedges - see the comments in my post for more details
**The Blue and Green arrows show how this bottom trend line (top pink line) of the falling wedge that BABA just broke out of has acted as either support or resistance since Oct 2021.
It was first support in October 2021, immediately before the stock crashed through at the end of that year to beginning the bottoming process that has played out since then.
Over the following year the line then acted as resistance with multiple failed breakouts.
After the capitulation in late Oct 2022, the stock rallied up to this line, and consolidated along it for a few weeks before breaking out to its high in the low 120s.
Since this breakout the line has acted as support, indicating to me that we are in the final phase of the bottoming process, which is confirmed by the breakout of the falling wedge last week.
The stock price is currently 'checking back' to the top of that wedge, at very low volume (as is typical for a wedge breakout), before I expect we will see the next leg up for a test of the support levels ~100$, and an attempt at breaking the WHITE neckline of the inverse head and shoulders.
A measured move of the inverse head and shoulders would then take the price up into the 180s over the next number of months.
Not advice, do your own due diligence. Fingers crossed, and good luck to the longs!

BABA upAlibaba is China's — and by some measures, the world's — biggest online commerce company. Its three main sites — Taobao, Tmall and Alibaba.com — have hundreds of millions of users, and host millions of merchants and businesses. Alibaba handles more business than any other e-commerce company.
