AAPL Weekly Options Trade Plan 2025-04-16AAPL Weekly Analysis Summary (2025-04-16)
Below is a synthesized analysis of the AAPL data and the five model reports:
──────────────────────────────
SUMMARY OF EACH MODEL’S KEY POINTS
• Grok/xAI Report – Observes a slightly recovered 5‐minute bounce but a generally volatile, declining daily trend. – Notes bearish technicals (price below EMAs, RSI recovering from oversold levels but MACD still below signal) and mixed sentiment (max pain at $202.50 with heavy put volume). – Recommends a trade on the $190 PUT given its attractive liquidity and proximity (–2.60% from current price).
• Claude/Anthropic Report – Highlights AAPL trading below key EMAs with persistent bearish momentum on both short and daily timeframes and a downtrend of –17% over 30 days. – Points out oversold conditions on the 5‑minute chart with continuing bearish pressure on the daily charts, alongside caution from negative news. – Chooses the $190 PUT as the best blend of risk and reward given its liquidity and technical setup.
• Gemini/Google Report – Emphasizes AAPL’s price below intraday and daily EMAs, with the short-term bounce near the lower Bollinger Band offering a minor contradiction. – Underlines strong bearish sentiment supported by high VIX and negative news, while noting resistance at the call side. – Recommends a bearish pick – the $187.50 PUT – though with a similar rationale as the others (i.e. trading just out‐of‐the‐money to capture a move).
• Llama/Meta Report – Notes bearish indicators including price under moving averages, low RSI, and MACD below the signal line. – Recognizes key support and resistance levels (supports near $194 and resistance near $197) and the opposing pressure suggested by max pain. – Ends up favoring a moderately bearish setup with the $190 PUT given its attractive liquidity and risk profile.
• DeepSeek Report – Reviews the technical and sentiment picture and concludes a moderately bearish position, underscored by negative news and broad put interest. – Emphasizes that a break from near-term support (around $194) could steer the price toward the $190 area. – Also recommends the $190 PUT, noting that its setup offers a reasonable risk/reward profile.
────────────────────────────── 2. AREAS OF AGREEMENT AND DISAGREEMENT
• Agreement: – All reports agree that AAPL is trading in a bearish environment overall, with price below key moving averages and a downtrend on daily charts. – There is a common focus on the options chain, where puts at or below $190 are highly liquid and carry significant open interest. – Every model, despite minor nuances, leans toward buying a naked PUT as the trade idea for this weekly options expiry. – All analysts recommend an entry at market open.
• Disagreement: – One model (Gemini/Google) slightly deviates by suggesting a $187.50 PUT as an alternative to $190, while the majority favor the $190 strike. – The exact profit target and stop‐loss levels differ somewhat between models, but all align on the general risk controls and short-term nature due to weekly expiration.
────────────────────────────── 3. CONCLUSION AND RECOMMENDED TRADE
Overall Market Direction: • Consensus is moderately bearish. Despite a brief short-term bounce noted on the intraday charts, the dominant trend and negative news sentiment favor further downside.
Recommended Trade: • Trade: Buy a single-leg, naked PUT option on AAPL • Expiration: Weekly (April 17, 2025) • Strike and Price: The $190 PUT (with an Ask around $0.83; it is about 2.60% below the current price) • Strategy Rationale: – This strike is liquid (high volume and open interest) and is supported by the bearish bias from momentum indicators and negative sentiment. – Although the premium of ~$0.83 is a bit above the preferred $0.30–$0.60 band, it is justified by the sharper risk/reward setup in this environment. • Entry Timing: At market open • Proposed Risk/Reward: – Profit Target: Approximately a 50% gain on the premium (target near $1.25) – Stop-Loss: Approximately a 50% loss on the premium (stop-loss near $0.42) • Confidence Level: 70% • Key Risks and Considerations: – A brief intraday bounce (short-term oversold recovery) could push prices above support, triggering the stop-loss. – Any unexpected news or a reversal in overall market sentiment may rapidly alter the risk profile given the short-dated expiration. – Monitor price action closely at open, as weekly options are particularly sensitive to early volatility.
────────────────────────────── 4. TRADE_DETAILS (JSON Format) { "instrument": "AAPL", "direction": "put", "strike": 190.0, "expiry": "2025-04-17", "confidence": 0.70, "profit_target": 1.25, "stop_loss": 0.42, "size": 1, "entry_price": 0.83, "entry_timing": "open" }
Disclaimer: This newsletter is not trading or investment advice but for general informational purposes only. This newsletter represents my personal opinions based on proprietary research which I am sharing publicly as my personal blog. Futures, stocks, and options trading of any kind involves a lot of risk. No guarantee of any profit whatsoever is made. In fact, you may lose everything you have. So be very careful. I guarantee no profit whatsoever, You assume the entire cost and risk of any trading or investing activities you choose to undertake. You are solely responsible for making your own investment decisions. Owners/authors of this newsletter, its representatives, its principals, its moderators, and its members, are NOT registered as securities broker-dealers or investment advisors either with the U.S. Securities and Exchange Commission, CFTC, or with any other securities/regulatory authority. Consult with a registered investment advisor, broker-dealer, and/or financial advisor. By reading and using this newsletter or any of my publications, you are agreeing to these terms. Any screenshots used here are courtesy of TradingView. I am just an end user with no affiliations with them. Information and quotes shared in this blog can be 100% wrong. Markets are risky and can go to 0 at any time. Furthermore, you will not share or copy any content in this blog as it is the authors' IP. By reading this blog, you accept these terms of conditions and acknowledge I am sharing this blog as my personal trading journal, nothing more.
AAPL trade ideas

Apple Wave Analysis – 16 April 2025
- Apple reversed from resistance level 210.00
- Likely to fall to support level 190.00
Apple earlier reversed down from the resistance zone between the resistance level 210.00 (former support from the start of March), 20-day moving average and the 50% Fibonacci correction of the impulse wave (1) from February.
The downward reversal from this resistance zone stopped the previous medium-term correction (2) from the start of April.
Apple can be expected to fall to the next support level 190.00 – the breakout of which can lead to further losses toward the next support level 170.00.

Apple will decrease more ? I reckon Apple stock will drop to around $175, based on my gap trading analysis.

AAPL moves in steps of 20% and sometimes 30% Many stocks move in steps thats why trendlines work. But in some stock the steps are not very clear, But Apple the steps are very clear.
Here the price rejected by trendline and could be great time to short and also completes 20%
The steps are caused because stock holders expect that return before they sell off

AAPL Technical Analysis (Trading Perspective)Price Structure:
AAPL has bounced from the recent low around $168 and is now climbing within an upward price channel. Price is attempting to reclaim the psychological $200 level, now acting as short-term resistance.
Trendline Channel:
A bullish channel has formed from the April 9th reversal, and the current price is near the midline. Price is showing consolidation just below a previous resistance level at ~$200.32, which aligns with the upper gamma levels.
Key Support/Resistance Levels:
* Resistance: $200.32 → key gamma and technical resistance
* Support: $185.29 (confluence of HVL + breakout area)
* Critical Support: $168.13 → the base of recent bounce
Volume & RSI:
* RSI is trending upward but starting to curve slightly at the 60 zone, showing bullish but cautious strength.
* Volume during the bounce shows aggressive buying but has tapered off recently — signaling a possible pause or retest before continuation.
Bias: Neutral-Bullish (watch for $200 breakout confirmation)
💡 Options GEX Analysis (For Option Trading)
Gamma Exposure (GEX) Levels:
* Highest Positive GEX / Gamma Wall: $200
→ A breakout above this may lead to a gamma squeeze toward $205–$220.
* Resistance Levels:
* $205 (12.8% GEX8)
* $220 (35.5% / 2nd Call Wall)
* Put Walls / Support:
* $185.29 = HVL (04/17 expiry)
* $180 and $170 have layered PUT GEX walls acting as support (–22% to –25%)
IV & Sentiment:
* IV Rank (IVR): 73.1 (elevated — premiums are rich)
* IVx avg: 68.5
* Put/Call Skew: Puts at 33.2% dominance, indicating hedge pressure, but not panic.
* Sentiment Flags: 🟢🔴🟢 → mixed signals: volatility + hedging pressure but potential support at $185+
🔁 Trading & Option Strategy Suggestions
📊 For Stock Traders:
* Bullish Play: Watch for breakout and retest above $200 → Target $205, $220
* Bearish Play: Rejection at $200 + breakdown below $185 = possible fade toward $175–$168
* Neutral Range Play: Between $185 – $200, consider scalping intraday using EMA/VWAP confluence
🧠 For Option Traders:
* Bullish Strategy:
* Debit Call Spread: Buy 200C / Sell 210C (cheap gamma play on breakout)
* Short Put Spread (Cash-secured): Sell 185P / Buy 175P if price consolidates above 190
* Bearish Strategy:
* Put Debit Spread if price rejects $200: Buy 195P / Sell 185P
* Avoid naked calls — IV is high, and premiums are inflated
🧭 Final Thought:
AAPL is at a decision zone with significant option market activity clustered around $200. A breakout here could trigger a squeeze toward $220, but failure may bring a retest of the $185–$180 range. The GEX layout shows dealer positioning supports upward movement above $200 but is still hedged underneath. Be nimble — wait for confirmation, and don't chase unless the breakout holds.
This analysis is for educational purposes only and does not constitute financial advice. Always do your own research and manage your risk.

APPLE: Long Trade with Entry/SL/TP
APPLE
- Classic bullish pattern
- Our team expects retracement
SUGGESTED TRADE:
Swing Trade
Buy APPLE
Entry - 198.05
Stop - 191.79
Take - 216.53
Our Risk - 1%
Start protection of your profits from lower levels
Disclosure: I am part of Trade Nation's Influencer program and receive a monthly fee for using their TradingView charts in my analysis.
❤️ Please, support our work with like & comment! ❤️

$AAPL This is going to burst... $220 target.NASDAQ:AAPL : Expecting a move to $210 easy off the $200 zone then to the target of $220. Lots of testing in that area. I think $210 is a clear "gimme." Not even close to overbought, with the volatility this can ramp up. Technically look great to me. Push up to 200EMA/SMA located above $220 zone ($221 and $228).
wsl.

APPLE On The Rise! BUY!
My dear friends,
Please, find my technical outlook for APPLE below:
The instrument tests an important psychological level 198.05
Bias - Bullish
Technical Indicators: Supper Trend gives a precise Bullish signal, while Pivot Point HL predicts price changes and potential reversals in the market.
Target - 214.26
Recommended Stop Loss - 187.76
About Used Indicators:
Super-trend indicator is more useful in trending markets where there are clear uptrends and downtrends in price.
Disclosure: I am part of Trade Nation's Influencer program and receive a monthly fee for using their TradingView charts in my analysis.
———————————
WISH YOU ALL LUCK

Apple gap fill potential - Grok Ai sees option activity Grok ai analyzed the option chain for me:
Call Volume Strike Price Put Volume
---------------------------------------------------------------------------------------
* 155.00 *
* 160.00 *
* 165.00 ****
* 170.00 ******
* 175.00 *****
** 180.00 *******
* 185.00 ****
* 190.00 *****
***** 195.00 ***
********* 200.00 ***
****** 205.00 *
********* 210.00 *
***** 215.00 *
*********** 220.00 *
****** 225.00 *
******************** 230.00 *
** 235.00 *
*** 240.00 ***
* 245.00 *
***** 250.00 *
Ai found lots of in interest upward call strikes.
Gap, on the chart may be the thesis.
Get apple right, and youll understand qqq , spy, dia, its so big.
Fundamentally, Im not a long term fan of apple, but cant ignore the mag seven large caps giants.

AAPL LTF Wave count ( 40 years!)
My long term wave count for apple completes. It has got a mind-blowing and exponential growth over the 40 years and has it come to THE end? Elliot waves can't tell really because wave analysis can always yield multiple scenarios based on waves and sub-wave counts, that's why Elliot wave is an amazing tool regardless you agree or not.
I always prefer not use log chart when wave counting because it will distort the trend line which is important for wave analysis.
My conclusion: APPL has either finished its long-term ascending wave or it still has two more huge waves up till a few years later.

Apple respite before sell offApple bounced straight of major support at circa $170, with the SMI now also rising we could see a few weeks of short term respite before continuing down to test the major support line again. Also notice a backtest of the rising trend at around 21%.
Long term view is still bearish, don't think we've seen the yearly bottoms yet. Will be interesting to see how this plays out especially with bonds.

Apple, Will we see 150$ ???Hello traders, Hope you're doing great. What are your thoughts about
AAPL ?
Our last analysis went exactly as we predicted and hit our target; But what's the next target ?
For upcoming weeks, I expect an upward correction at first and after that I expect another SELL OFF situation in the market that causes a huge drop in stock market, my first Target is 157$.
This post will be Updated.
Trade Safe and have a great week.

APPLE Best buy opportunity of the last 6 years.Back in August 02 2024 (see chart below), we introduced this model on Apple Inc. (AAPL) that had high probabilities of success at predicting Cycle peaks:
We may have not hit $280 but $260 is close enough especially if you are a long-term investor that values buying low and selling high.
Now that the price has corrected by -35% and just hit the 1M MA50 (blue trend-line) for the first time in almost 10 years (since July 2016), it is time to revisit this macro-model once again.
As you can see, -35% corrections have been present on every Cycle since the January 2009 bottom of the Housing Crisis. The pattern that the stock follows is very specific and it starts with a prolonged correction, the Bear Cycle essentially, which is a lengthy correction phase, such as the 2008 Housing Crisis, the 2015/16 China slowdown and the 2022 Inflation Crisis.
Then a very structured uptrend phase starts in the form of a Channel Up that leads the market to its first peak, followed by a shorter, quicker correction phase that tests the 1M MA50 and rebounds. The rebound is the final bull phase of the Cycle, usually strong and sharp and leads to the eventual Cycle Top and then starts then new Bear Cycle (prolonged correction).
Right now the current 4-month correction is technically, based on this model, the new shorter correction. Being more than -35% in size, the last one larger than this was the previous short correction of the last Trade War in October 2018 - January 2019 (-38%).
The similarities don't stop here but extend to the 1M RSI as well, which just entered its 25-year mega Buy Zone that has been holding since December 2000 and the Dotcom Crash! In fact the last time Apple's 1M RSI was this low was in June 2013, which was the bottom of the 1st short correction on our chart.
This remarkable symmetry just shows how similar the current phase is with its previous ones and if the symmetry continues to hold, we should be expecting a strong recovery to start. Even if the price makes a slightly deeper low as -38% (like the January 2019 bottom), we may still expect the minimum rise that it had all those years shown on the chart, +145%, which translates to a potential $390 Target long-term.
It is in times like this, that patient long-term investors filter out the news noise, make their unbiased moves and maximize their profit.
-------------------------------------------------------------------------------
** Please LIKE 👍, FOLLOW ✅, SHARE 🙌 and COMMENT ✍ if you enjoy this idea! Also share your ideas and charts in the comments section below! This is best way to keep it relevant, support us, keep the content here free and allow the idea to reach as many people as possible. **
-------------------------------------------------------------------------------
💸💸💸💸💸💸
👇 👇 👇 👇 👇 👇

AAPL - Strong Support 164NASDAQ:AAPL Strong Support at 164. If fails to hold that level, It can go down to 129.

Apple Wave Analysis – 9 April 2025
- Apple reversed from the support zone
- Likely to rise to the resistance level 180.00
Apple earlier reversed up from the support zone surrounding the long-term support level 170.00 (which has been reversing the price since the end of 2023) – standing very far below the lower weekly Bollinger Band.
The upward reversal from the support level 170.00 stopped the previous weekly downward impulse wave 3 from February.
Given the strength of the support level 170.00 and the oversold weekly Stochastic, Apple can be expected to rise to the next resistance level 180.00.

Apple's Fall: Time to Pick Some Fruit, or Let it Rot?Apple's chart looks bruised! After a big drop, it's testing a key support zone around $170. A bounce here could be a buying opportunity, especially if the MACD turns bullish. BUT, failing to hold this level could mean more pain ahead. Is Apple a bargain at these levels, or is there more downside to come?

AAPLAAPL is in a correction phase. The price still has a chance to test the support zone of 154.3-137.3. If the price cannot break through the 137.3 level, it is expected that in the short term, there is a chance that the price will rebound. Consider buying the red zone.
🔥Trading futures, forex, CFDs and stocks carries a risk of loss.
Please consider carefully whether such trading is suitable for you.
>>GooD Luck 😊
❤️ Like and subscribe to never miss a new idea!

4/8/25 - $aapl - why it's the main stock to watch4/8/25 :: VROCKSTAR :: NASDAQ:AAPL
why it's the main stock to watch
- up until recently the TVC:TNX (10Y) was headed lower. this changed in the last few sessions. let's leave the various "explanations" beyond this (perhaps the comments) and simply focus on price.
- the reason NASDAQ:AAPL is of particular importance is given it's supreme weighting in the SP:SPX (up until recently the largest cap, now NASDAQ:MSFT as of today), but more importantly it's bond-like cash flow stream and high ROE's given strong brand. this affords investors (even those who eschew tech generally, like uncle warren) the ability to "look through" various disruptive and often more terminal-weighted names, even if they're megacaps as well, like $nvda. the current fcf yield on NASDAQ:AAPL is almost identical to the 10Y.
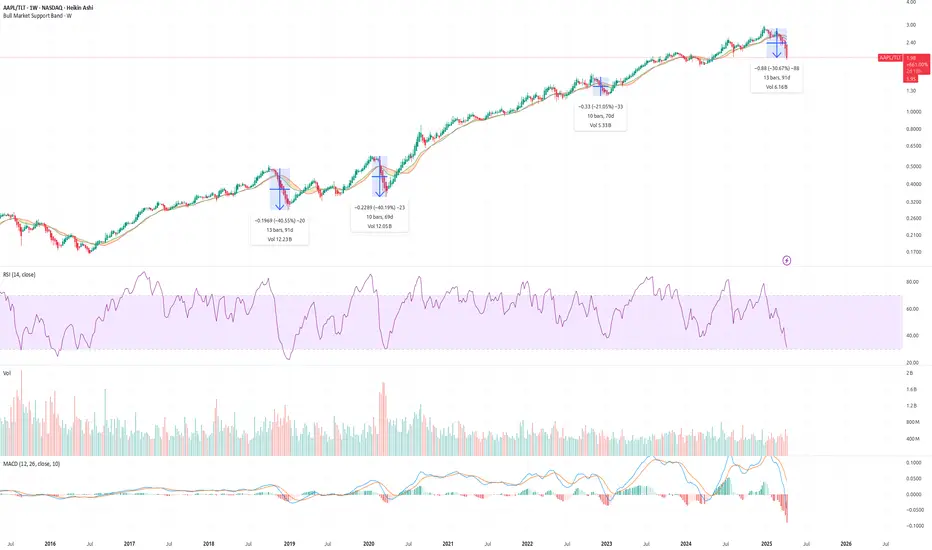
- when you look at the above chart which plots NASDAQ:AAPL vs. the NASDAQ:TLT (price of apple divided by the 10Y), you'll notice two obvious things (and i've used heikin ashi candles to further underscore the points).
1/ aapl has consistently outperformed the long bond in the last decade+
2/ period of multi-month drawdown vs. the 10Y have averaged about 80 days and ~30% lower, nearly identical to where we are today
- when we consider the "reinvestment risk" of something like the 10Y for something like aapl, and considering the historical parallels, one would ask the question "is this over". and that's why this is so interesting/ important to watch $aapl.
- beyond it's growing digital services contribution to the business, the core product (which delivers these services) is still mainly based in the "china complex", whether that's assembly, or within a headline's scare away in Taiwan (w/ their chips). so it's *very* exposed to what's happening here and a liquid canary for sentiment as to what's happening.
- and beyond a resolution to the tariff debacle (if i may be so polite to call it that and stick to the points I'm trying to make in this post), the 10Y is behaving in a way where confidence might be shifting more toward a pseudo-sovereign LIKE APPLE given it's bond-like characteristics (points above) versus this gov't issued IOU. In other words, would you trust NASDAQ:AAPL stock (or even their bonds for that matter) to appreciate (or the yield to decline) versus the US 10Y. And there is the funny conundrum... and the paradigm shift happening in real time.
Said another way:
1/ if the 10Y starts to behave, it's likely because there's some market belief of tariff resolution and a path forward (let's call it "look thru" or "reduced uncertainty") and in this scenario NASDAQ:AAPL like outperforms any benefit to lower yields given the recent pullback and given the chart/ comments above.
2/ and if the opposite is true, and the market continues to call BS on this whole ordeal, the 10Y is likely to dramatically underperform NASDAQ:AAPL 's stock price and/or the bottom for NASDAQ:AAPL one could argue is much more limited (perhaps 10-15%, at most 20%) vs. the 10Y (TLT), and from there the risk-reward (the second-order implication of this) is still an NASDAQ:AAPL share price that, again, dramatically outperforms the 10Y.
While is all to say: I am closely watching NASDAQ:AAPL as if it were the most important economic variable in this whole equation and believe it's much closer to not only a trade-able bottom but potentially a multi-year floor price than the market's current sentiment would lead you to believe. And without getting too long winded (which this already is), the similar logic applies albeit to a slightly lesser degree for NASDAQ:AMZN , NASDAQ:NVDA , NASDAQ:MSFT and a few other mega caps ( NASDAQ:META , NASDAQ:GOOGL ) each with their own quirks/ "features" or "drawbacks" in the current climate/ topic.
So while I'm still packing 25% cash on the books, eventually this old man is going to call BS. And the big liquid stuff will be a good place to re-accumulate before we can distribute into the slightly more nuanced names (of which I own a few - if u follow u know).
Let's see. Hope it helps your mosaic. Lmk (and especially) if you disagree.
V
(AAPL) Crumbling in Chaos? Here's How Smart Traders Might Pivot 🔍 Market Mood: Everything’s Broken, Or Is It?
We're not just watching candles here — we're watching psychology unravel. This isn't your average downtrend. The current chart screams capitulation, and the market isn't following textbook TA. EMAs, Fibs, CHoCH, BOS — they’re all being run over by macro fear.
But chaos is a signal too — if you know how to listen.
🔍 Technical View — The Breakdown Inside the Breakdown
* Trendlines? Crushed. The clean diagonal resistance failed to offer a bounce. Instead, AAPL dropped like a rock off a cliff.
* Structure: AAPL attempted a weak pullback but immediately rejected lower, forming new lows. There’s no confirmation of CHoCH or any reclaim.
* Current support: $170.56 (barely holding). Below this? It’s an air pocket to $165 and possibly $150 based on historical liquidity voids.
* MACD: Turning down again — bearish crossover is alive.
* Stoch RSI: Also curling lower, suggesting momentum is building for further downside.
🧠 Insight — When TA Fails, Price Memory Doesn't
TA isn’t “failing” — it’s evolving. In chaotic environments, price memory becomes king.
* Price memory zones: Think about levels where mass volume occurred before consolidation — not just lines. These zones become magnets.
* Liquidity pockets between $175–$165 suggest algos will keep hunting stops there.
So what should traders do when TA doesn’t give clear answers?
📊 TrendInfo Snapshot:
* MA, DMI, RSI, MACD, Stoch, BBP — All Bearish
* Fear Index: -21.68
* Recommendation: Sell (50%)
This isn’t just a red dashboard — it’s a sentiment echo. Most retail traders are now too scared to buy, and that’s usually when big money starts accumulating slowly under everyone’s nose.
🧨 Options GEX — Gamma Exposure Tells The Hidden Story
* Highest Negative GEX / PUT Support: $170 — A strong defense line… for now.
* Put Positioning: 44.8% of the chain leans bearish.
* Call Resistance: $195–$202 range — thick walls.
* IVR: 113.5 — volatility is premium-priced.
* Options Oscillator: Red blocks dominate — no sign of bullish reversal, yet.
The takeaway? Market makers are likely short gamma, which means they’re forced sellers into dips. This creates momentum cascades unless a liquidity event reverses the flow.
🧭 Strategy — Don’t Predict, Prepare
1. If AAPL Reclaims $175+ with Volume: That’s the first sign big buyers stepped in. Look for confirmation via a CHoCH and MACD cross-up.
2. If $170 breaks with momentum: It's not just retail panic — institutions may be offloading too. Watch for a flush into $165 or even $150 for a fast scalp or long-term buy zone.
3. No-man’s zone ($170–$175): This is where patience pays off. Let price prove itself.
💭 Final Thoughts: Adapt Your Lens
In chaotic times, don’t rely on indicators alone. Use a confluence of TA, sentiment, and price behavior. This is the moment where reactive trading — not predictive gambling — separates pros from the rest.
This chaos isn’t the end — it’s the forge. The next rally will be shaped by traders who learned to read beyond lines and candles.
Disclaimer: This analysis is for educational purposes only. It does not constitute financial advice. Always do your own research and manage your risk appropriately.

AAPL 4/8/25Gotta love it when a plan comes together so perfect!
Tried to rebound and could not, shooting right to the 165-169 range im looking to load up in
End of month or sooner?
I like the 8th and 28th as my days to DCA.
Tempted today w it being down around 5% but discipline builds portfolios.... right?

High probability put sale on AAPL AAPL is at the 200 sma on the weekly. First time since 2018. This level, we get over $2! Close to 2%. WHAT A SPOT to own apple

AAPLAAPL price is in the correction period. If the price cannot break through the 258.56 level, it is expected that the price will drop. Consider selling the red zone.
🔥Trading futures, forex, CFDs and stocks carries a risk of loss.
Please consider carefully whether such trading is suitable for you.
>>GooD Luck 😊
❤️ Like and subscribe to never miss a new idea!

qwe2Apple Inc. is an American multinational corporation and technology company headquartered in Cupertino, California, in Silicon Valley. It is best known for its consumer electronics, software, and services
