ADBE trade ideas

Breakout and retest of symmetrical triangle(sell)Expected to go down to 372.00 after breaking the symmetrical traingle...

Adobe - Still to Fall or Has It Reached Support Area? Is one of the leading digital media companies Adobe already attractive for investors?
Let's look at fundamentals and technical aspects.
Fundamental indicators:
Revenue and Profits - demonstrated consistent and explosive long-term earnings growth over the past 10 years
Profit margin - impressive 40% in 2021
P/E - still overpriced with 37x ratio
Liabilities - no problems with debt
Technical Analysis (Elliott Waves):
The sharp drop in March 2020 has completed a Running Flat correction that lasted for more than year and a half
Since then Adobe has enjoyed over 170% gain in its share price with a clear impulse movement
Having peaked at nearly $700 in November 2021 it has completed global wave 3 that started in August 2011 - very lengthy growth cycle
And hence it is time for even longer correction than the one we observed in 2018-2020, the duration target is end of 2023
Global wave 4 has already started with rapid correction from the historic high, the potential support levels using Fibonacci retracement are 0.5x and 0.618x, $360 and $280 respectively. But given still quite high P/E ratio it is more likely for Adobe to reach lower level of this zone
Once support is found then we are likely to observe a very lengthy corrective movement in the range between the lower support level and the maximum price of $700, which will provide short term opportunities for bull and bears
What do you think about this scenario for Adobe ?
Please share your thoughts in the comments and like this idea if you would like to see more stocks analysed using Elliott Waves.
Thanks

Adobe (NASDAQ: $ADBE) Wicks Thru Golden Pocket! 🕯️ Adobe Inc. operates as a diversified software company worldwide. It operates through three segments: Digital Media, Digital Experience, and Publishing and Advertising. The Digital Media segment offers products, services, and solutions that enable individuals, teams, and enterprises to create, publish, and promote content; and Document Cloud, a unified cloud-based document services platform. Its flagship product is Creative Cloud, a subscription service that allows members to access its creative products. This segment serves content creators, workers, marketers, educators, enthusiasts, communicators, and consumers. The Digital Experience segment provides an integrated platform and set of applications and services that enable brands and businesses to create, manage, execute, measure, monetize, and optimize customer experiences from analytics to commerce. This segment serves marketers, advertisers, agencies, publishers, merchandisers, merchants, web analysts, data scientists, developers, and executives across the C-suite. The Publishing and Advertising segment offers products and services, such as e-learning solutions, technical document publishing, web conferencing, document and forms platform, web application development, and high-end printing, as well as Advertising Cloud offerings. The company offers its products and services directly to enterprise customers through its sales force and local field offices, as well as to end users through app stores and through its website at adobe.com. It also distributes products and services through a network of distributors, value-added resellers, systems integrators, software vendors and developers, retailers, and original equipment manufacturers. The company was formerly known as Adobe Systems Incorporated and changed its name to Adobe Inc. in October 2018. Adobe Inc. was founded in 1982 and is headquartered in San Jose, California.

Adobe (ADBE) | Quite Close To Technical Buying Area!Hi,
Criteria inside the box:
1. 50% drop from the ATH
2. Strong horizontal levels
3. The trendline
4. EMA's from different TFs
5. Mid-numbers
Do your own research and if its matching with mine then you are ready to go.
Regards,
Vaido

ADBE Symmetrical Triangle Breaking DownWe are currently two hours into todays session. ADBE has consolidated in a symmetrical triangle pattern for the past 3-4 weeks. This pattern is generally a neutral pattern with a bias toward the current trend. The current trend is down since the 20ma < 50ma < 100ma. My CB-RSI indicates downward pressure and MACD is nearing a bearish crossunder. The price action has broken the consolidation to the downside and is pointing to former support near 415. I think that would be a good target. Should that support fail, I will look to 485 as the next target. Risk Management is key. I will stop the trade if we close above the 5 ema which happens to be inside of the consolidation range.

ADBE respecting this channelADBE has been riding inside this channel for months now. (Zoom out in the daily TD for a better view)
Give market weakness, i would favor another leg lower after rejecting at the top of the channel.
However if it breaks to the upside, could see a strong push towards $460.

MY NEWBIE WAY OF THINKINGThat was on 4th of these month as in work on something it was released this price with which my lard of word to express I tame it the high side of the yesterday pre-market close, between 468.95/493.30
I think if it is the way it's work as in retesting manners of any trending trend, it will if not today test that zone from where today have is beginning.


ADBE holding strong support 417 to 420 zoneADBE is a fundamentally great company with a lot of moat.
It is currently holding an accumulation zone & showing relative strength compared to other tech stocks,
Not trading advice

Short-term Bullish on AdobeI'm looking at ADBE today. Seeing a lot of good signs for a shorter-term play. I'm seeing Bullish Divergence on the Daily chart (as well as recent 4-hr Bullish Divergence). In addition, ADBE has entered a *strong* buy zone on the lower indicator (something that hasn't happened since 2011). Working against ADBE is the negative momentum, however, I think there's a good chance we see bulls step in over the next few weeks. I'm interested in increasing my exposure here.
Good Luck
----------------------------------------------------------------
These are my personal views and not financial advice. Please do your own research before investing.
I'd love to hear your thoughts, ideas and feedback. Feel free to Comment and I'll try and get back to you quickly.
If you appreciated this analysis, consider Liking or Following . Thanks!

Wolneyyy's Quarterly Update!Hey guys! Hope all is well.
I get lots of questions about what companies I like and what companies I don't like. I review the top ~900 or so companies every quarter to keep my analysis fresh.
Here's the most recent update: 4/1/2022.
Compounders: tradingview.com
Value Destroyers: tradingview.com
Let me know in the comments if you have any questions about my reasoning!

ADOBE is preparing for take-off!ADOBE has several signals suggesting a take-off!
First, it has broken a major dynamic resistance in price, which has been formed since November 2021.
Second, it has broken another major dynamic resistance in RSI, which has been formed since November 2021.
Third, the daily price has formed a reverse head and shoulders.
The only problem is Ichimoku which shows resistance at the current time. Wait for a clean break out and retest of the neckline and then enter to gain massive profit!


ADBE Short PositionWe can see a nice rejection off of the 540 level which is also the previous swing low that was set on December 21st. ADBE has a high PE ratio of 52.88 which puts it in the category of stocks that are selling off right now due to the federal reserve scheduling rate hikes for next year and reducing it's balance sheet. We can also see the supply/demand shifting to the down side as sellers continue to move their entries lower in this downtrend that was established after the earnings sell off. I will be looking to trim or take profit at 520 and 500 depending on market conditions when the price reaches those levels. 520 provided resistance for a few months while this stock consolidated before breaking out, increasing the chances of 520 acting as support. We could see a retest of 540 before this turns down in which case I will be looking to add to my position. I will be setting a stop loss at 541.65 (just above yesterday's high). If ADBE breaks above that level then we could see more upside and that would also jeapordize the short position setup.

NASDAQ: ADBEin the 2hr timeframe we can see price is creating an equal high in the resistance area , and when price bounced from the resist to the support ,
We see a change of structure with a form of inverse head n shoulder pattern , with the rejection at the 78.60% just at the golden area ,
in this case we can take a long opportunity with the current oversold market , but we need price to break the EQH then we can a see a push to the upside .
RR 1:4
let me know what do you think about this one !

ADBE BuyAfter earning trade with risk reward ratio 1 : 3
Double bottom set up and break above 20 EMA
Enter with Stop order.

ADBE Retest Trendline $429ADBE is been bearish after earning now its looks like it's ready to move higher and also it retested the trendline with support of around $429. If the market remains bullish we could see ADBE above $450.
Below is the link for the trade idea for the week of 03-28-2022 *all the content is for information only and it's not trading advice. Trading involves risk*
nimb.ws

Adobe near SMA200 on weekly chart.This is the weekly chart of Adobe, we can see that price is very close to SMA200. I would like to see it testing this support level, but i would also want a divergence at RVI and RSI. For now, none of the oscillators have a divergence at lows, but all 4 have a divergence at highs.

Adobe looking goodA possible swing set up looks to be presenting itself here.
Adobe got wrecked recently with chip shortages and supply chain issues and i finally think it will begin to reverse therefore i will be watching this.
bullish divergence also looks to be occuring with the RSI.
price has broken out of the falling wedge and seems to be re-testing the line.
use stop loss, 405 is a good one to use for a tight stop loss.
price targets are 480, 520, 580.
DYOR

ADBE Key Levels and is it time to go long?Adobe on Weekly.
1) Down by 43% from ATH.
2) If we do a fib retracement from covid lows to ATH, you see the current price is hovering within the golden pocket(.618 and.50)
3) Price is consolidating above 200 EMA and also above 200 SMA .
4) This has been a support zone in the past on multiple occasions.
5). This would be a very key level to watch, if it breaks below-- it can go down to 395sh levels-200 MA level.
6) Price is below AVWAP from covid low- acting as resistance.
7) I see RSI and MACD showing signs of reversal, but not yet.
8) Watching levels 430 for upside and 410 for the downside.
On the Fundamentals.. this company is projected to have an EPS of 15% for the next 5 years. Not bad of a growth

$NKE with a Neutral outlook following its earnings #Stocks The PEAD projected a Neutral outlook for $NKE after a Negative Under reaction following its earnings release placing the stock in drift D with an expected accuracy of 66.67%.

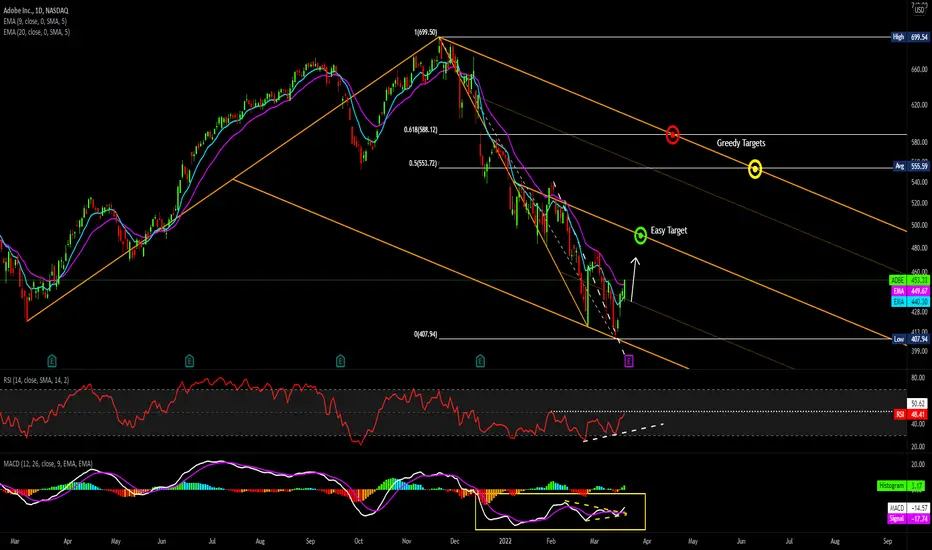
ADBE.pdfNASDAQ:ADBE
Adobe daily chart looking bullish.
This stock has been crucified all of Q1 2022.
A $100 upmove would only represent a 50% retrace of the plunge from the ATH.
ADBE is reporting earnings on Monday, thus we could see an explosive move higher if the results are solid.
Daily candles retested the lower median line of the inside pitchfork, while momentum oscillators are showing bullish divergence and starting to breakout.
The RSI just put in a bullish swing rejection, and is showing strong bullish divergence with a break above the previous RSI pivot high.
The MACD has spent all of Q1 2022 in the basement, and is showing bullish divergence with a recent cross above the signal line.
Cautious types can wait for the 9EMA to cross above the 20EMA. However, I will be going long this name on Monday's open.
I think a test of the median line is extremely likely, thus my first "Easy Target" is around $491 at the median line.
If last week's rally is sustained for a few more weeks, I listed two targets on the upper median line that correspond to 0.5 / 0.618 fib levels.
I will wait to see how price reacts to the median line before assuming those targets will be reached. (Will update the idea when/if that happens)