ADBE Bullish Flag continuation pattern ADBE is flagging after its huge run off lows last year. All moving averages are curling up and If we can clear this 505 level of resistance then a new ATH should follow.
ADBE trade ideas


I like the companyComing off a run with a reversal pin bar to touch that support and confirm the break, consolidate and then continue
Looks good at 495

ADBE near the resistance level of the Wyckoff PatternFor new entries: $ADBE (Adobe Systems Inc) is near the resistance level of the Wyckoff pattern. Look for a breakout with volume to confirm the breakout.
For ones holding a position and want to secure the profit of last rally, you can close the position and reopen with the pattern confirmation.

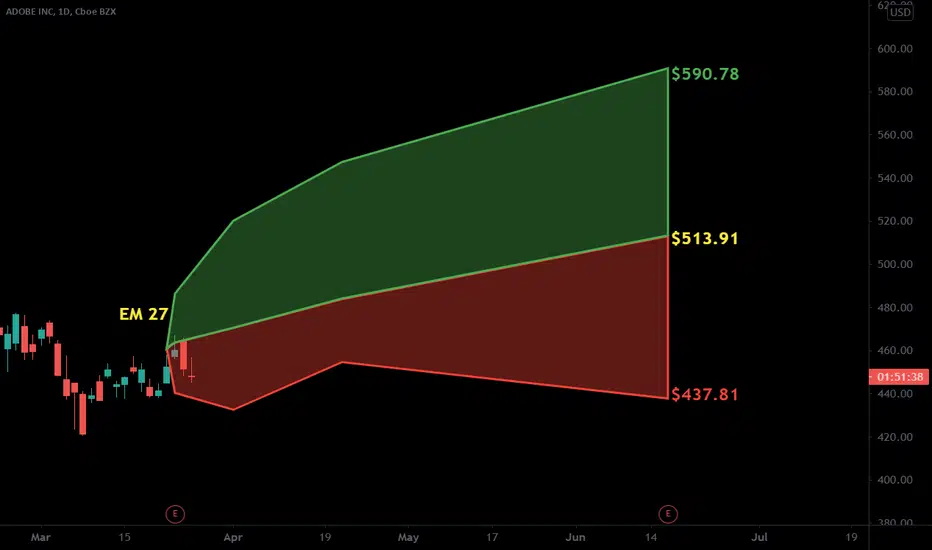
Massive Structure on ADBEToday we will take a look at the current situation on ADBE.
Key concepts:
a) Flag Pattern: This type of formation is considered a continuation pattern, meaning that after the breakout, we tend to observe a movement in the same direction as the previous impulse
b)Ascending Structure: using two trendlines, we can understand the upper and lower bands of any trend; when we have a breakout on any of the directions, we can use that to forecast possible movements on the breakout direction
c)Fibo Extensions: We use them to forecast possible targets on a new impulse
Final Conclusion: We have an activation level on the green line and an invalidation level on the red line; the final target is the 2nd fibo extension, and we will use the first one as a risk-free level.
Thanks for reading!

Weekly flagReally nice chart here, today it made it to the start of gap fill and rejected on first attempt. Would like to see it come back down a bit and flag on daily from here before entering calls. If this breaks it should be a huge move. Has been consolidating since Aug 2020
ADBE: Another System-Based ShortI've developed a bearish algorithm/screener that screens for stocks with identified selling pressure / trend followed by a dead cat bounce that is likely to fail - which we will attempt to short. I'm trying to combine trend following and VFI trading principles for the coming bear market.
Components:
1. 200 EMA: below current market price (this is so we don't get stuck in short squeezes and such)
2. 50 day moving average above current market price (we want past clearly identified weakness over a sufficiently long period)
3. 10 day moving average below current price (we want a stock that has attempted to rally from the lows)
4. CMF<-0.1 (we want to screen out bottoming patterns such as Inverse Head and Shoulders whenever we can)
5. Moving Averages Ratings: Buy, Neutral, Sell - we don't anything with strong MA momentum indicators, and we don't want to be short squeezed.
6. Market Cap, Price, volume requirements

Look for the uptrend to develop with ADBEADBE is making an attempt to re-establish it's long-term uptrend. Check the ADX/DMI for a bullish crossover , confirmed by a choppiness indicator to transition from "rangebound" to "trending". 1st price target is around the 600 level. If this target is achieved, look for further upside to 700.
If the uptrend fails to materialize, have a stop-loss at 445 level. Stay in the trade as long as the price remains above the cloud.

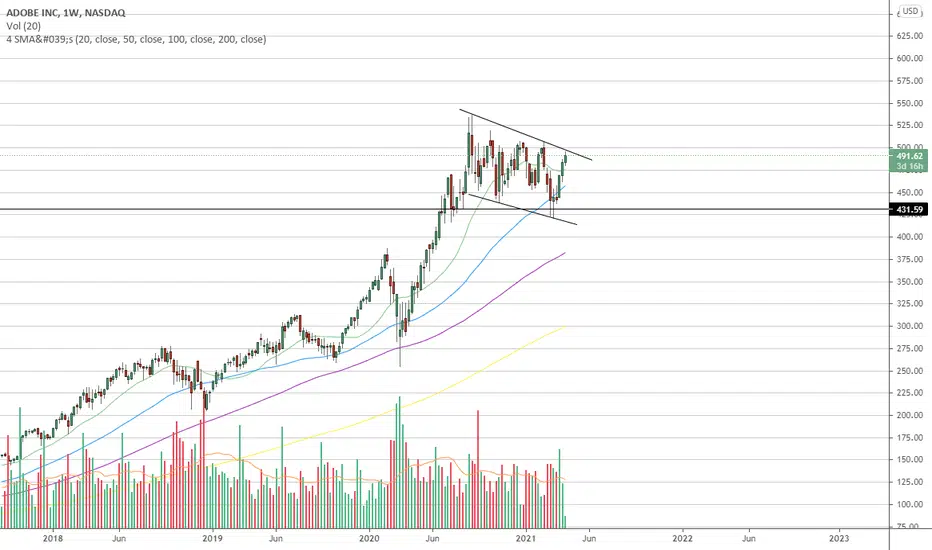
ADBE over 475.00Cloud/SaaS were some of the growth leaders pre and post-COVID but have significantly cooled off since the peak in August/September and did not rally to the degree other names did in November - February. ADBE is forming a flag on the weekly viewing shown here on the daily, entry provided at 475.00 over VPOC, price action resistance which also serves as a "round number" psych level.

ADBE regaining its rightful territory ADBE recovering well, back in it's rightful territory after great earnings, breezing through what could have been former-support-as-resistance. Regaining both its 50 and 200 day sma is great.

$ADBE nice bullish setup Even in the shaken market of last week its behaviour was really strong. It is leaving a really bullish setup. I would wait to see how the market is behaving next week before go in
TP1: 636
TP2: 711

$ADBE with a Bullish outlook following its earnings #Stocks The PEAD projected a Bullish outlook for $ADBE after a Positive over reaction following its earnings release placing the stock in drift B
If you would like to see the Drift for another stock please message us. Also click on the Like Button if this was useful and follow us or join us.


ADBE formed a consolidation PatternSeek for entry opportunities in the 1D chart above the 450.
Target Price: 535
Expected Return:19%


ADBE (NASDAQ) - Continue BullishGreetings
Humbled, we would like to thanks for your support who has already liked, commented and followed us. Your support, strengthens us, to help in analyzing the market. If you have any questions, feel free to send us message (inbox).
Pra Trading :
- Please care for Money Management
- Have a good psychology
- Do not be hurry to open position and do not do nothing if u see opportunity
- Evaluate and upgrade your trading plan
Execution Strategy :
- Know what you want to buy, see the Fundamental
- Decide that you are on investing or speculating
- Consider what your strategy based on Investing/Speculating
- Make Road Map Of Your Trading Plan
- Decide
a. Entry strategy
b. Cut loss
c. Target of Profit
Post Trading :
a. Do not be sad if you loss or do not be very happy if you win
b. Just become a normal without emotion, Do not put emotion into your trading
c. Evaluate your trading
d. Keep on Learning
e. Be Humble
Idea :
ADBE (NASDAQ) - Continue Bullish

Adobe technical buy point prepareno reason just for technical rebounce, skip this idea if the Q1 season report getting close

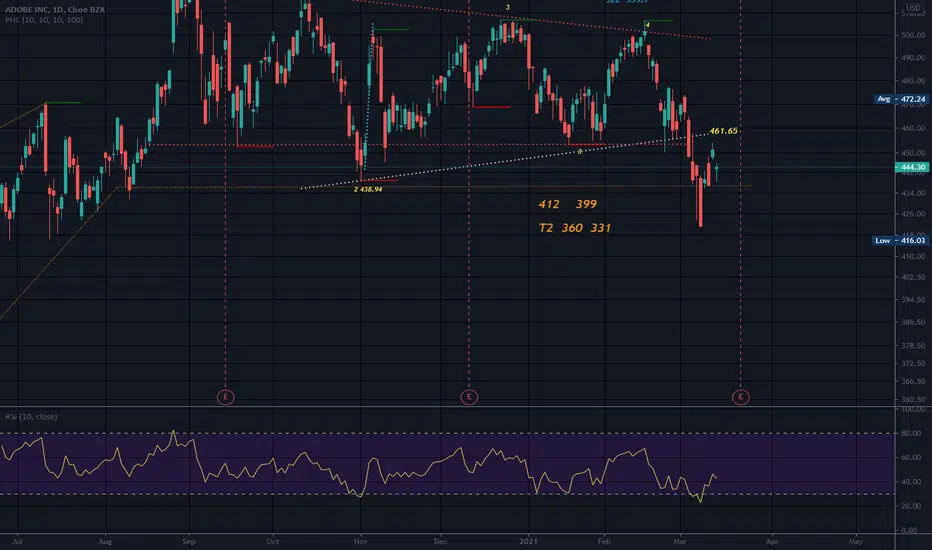
ADBE Further Downside?Looking at a triple top for ADBE in day view, followed by a breakdown below both the 20 and 200 day MA. Looks to have found support at 420, but hit the top of the downward trend line and is sitting at a previously established support level around 445. If ADBE fails to break up and follows the downward trend line, it will be forced to retest 420. If it fails and breaks down, the next support is at 385 and is weak, with the next strong support being around 320 from all the way back in April '20. If 420 fails, there is a probable 5% downside and possible 13%, if not more.
The RSI is showing weakness, while the Stoch, MACD, and Madrid sentiment are all beginning to do the same. I will be watching for a potential short opportunity in the next few days.
Many other charts, including TSLA, AMZN, NFLX, PYPL, NVDA, AAPL, PDD, ASML, are all showing similar weakness (the largest caps on the IXIC), while INTC is failing to break up through its most recent resistance. CMCSA, another large cap IXIC, appears to be strong but showing overbought on the RSI and Stoch.
Buckle up, it could be a rough week.

Symmetrical Triangle Rising Wedge Earnings 3-23Earnings on 3-23 AMC
Not sure what is up, or down )o: with ADBE. Perhaps market just felt it was high enough, for now anyway.
Maybe earnings will help this one.
Breaking to the upside from the rising wedge a while back is probably not helping. Rising wedges are usually long term patterns, but terminal in the end. Rising wedges affect supply and demand which is the heart of the market. They are not valid until bottom trendline is broken. ADBE has broken the bottom trendline. A strong stock does not fall that far as a rule. The definition of "not far" can vary )o: Rising wedges are caused by too much buying and lack of healthy pull backs, irrational exuberance. Sometimes the wedge does not affect the stock for a long time. Seems to hit most when a pull back occurs, and the pull back can be somewhat devastating. Perhaps there are not enough buyers left because everyone has already bought it? Then the panic selling kicks in?
No recommendation