Amazon (AMZN): Testing New Heights—What’s Next?🔥 LucanInvestor’s Commands:
🩸 Resistance: $228.50. A breakout targets $232 and $235, signaling continued bullish momentum.
🩸 Support: $224.00. A breakdown exposes $220 and $215 as key downside levels.
🔥 LucanInvestor’s Strategy:
🩸 Long: Above $228.50, aiming for $232 and $235. Increased buying volume will confirm strength.
🩸 Short: Below $224.00, targeting $220 and $215. A loss of support could lead to accelerated selling.
🩸 Amazon’s MACD indicates weakening momentum, but the stock remains above the 200 EMA, maintaining a bullish bias. Watch for volume spikes at $228.50 to confirm a breakout or at $224.00 for a breakdown. Seasonal trends support strong performance, with year-to-date gains of 47.65%.
👑 "Fortunes are built by those who act when others hesitate." — LucanInvestor
AMZN trade ideas

AMAZON - Very strong up trendNASDAQ:AMZN has just broken a new high levels.
Maybe a correction is also on the way.
It is just a new buying opportunity.
Do not lose what you have on your hand.

What Is The #1 Reason For Market Volatility?About two days ago,
I got into an argument with someone
Younger than me,
The way that person kept on teasing me
For being "older" was so not nice
Being an experienced person of life
Is something I hold dear to my heart.
It's the same with trading in the beginning it will look bleek
Like there is no way out.Like the younger folks are laughing at you
For being the "o.g."
In trading being the "o.g." is actually a good thing.
Because many traders lose control of their abilities to control their emotions
Like I lost my emotions
Two days ago.It sucks but that's how we learn in trading.
Look at this chart NASDAQ:AMZN
Notice the following 3 Steps:
👉The price is above the 50 SMA
👉The price is above the 200 SMA
👉The price has gapped up
The last step is very important because this price has rallied from
It's recent low point.
The market is all about emotions and if you can control your
Emotions and stick to your strategies
You will win the game.
🚀 Rocket boost this content to learn more 🚀
Disclaimer ⚠️ Trading is risky please learn how to use Risk Management And Profit Taking Strategies.
Also learn what to trade with a simulation trading account.

Amazon - The +150% All Time High Breakout!Amazon ( NASDAQ:AMZN ) is hugging the previous all time high:
Click chart above to see the detailed analysis👆🏻
Amazon has been moving sideways for almost four years, consolidating between support and the previous all time high. After retesting the resistance over and over again, it is just a matter of time until Amazon will break the previous all time high and start its next major bullish cycle.
Levels to watch: $190, $500
Keep your long term vision,
Philip (BasicTrading)

AMZN 6/6/2022AMZN
Jeff Bezos sold at the top and bought a yacht while The Jeff Bozos the clowns will buy the stock split thinking they’re getting a good deal.
That last leg of AMZN Uptrend which respected 50ema, started April ’20 and topped out Sept.’20. It closed below the 50ema that Sept. and price entered a Sideways market
AMZN moved sideways from Sept.’20 thru Jan.’22. During this time, Good ‘ol Jeff Bezos jumped ship Nov.5th ’21 @ 179 and jumped into an enormous yacht. The sly dog knew what was coming and exited at the top.
Jan’22 price broke down from this sideways range and confirmed the range to be a Distribution stage. Price fell from 165 down to 136. During this time, we also had Death Cross between the 50 & 200 ema to further signal the bearish conditions.
Price pulled back from 136 twice to previous Support looking to turn it into resistance. The market was very nice to the “investor”, gave them two chances to exit.
On the second pullback to resistance, we also had an Overbought Stochastic reading. This was our 1st entry to enter trade short. This short entry saw price move from 167 down to 102. This breakdown saw price make a lower low and confirmed the start of the downtrend for AMZN.
From the lower low made at 102, price pulled back to the 50ema which is acting as Dynamic Resistance level. Currently, we also have an Overbought Stochastic reading. This is the second entry to trade short. Downtrend + Pullback to resistance + Overbought Stochastic = Short Trade Entry
Entering trade short.
Entry: 124.79
Stoploss: 139
Target #1: 101.61, 18.56%, 1.63 RR ratio
Target #2: 83.86, 32.79%, 2.87 RR ratio

AMZN watch $231.73: Golden Genesis fib to mark a top and dip? Show here is a single fib series in three different time-frames.
"Genesis Sequence" is the DNA and growth pattern from birth.
The "Golden" multiples are always the strongest fibs to watch.
It is PROBABLE that we see a pullback here.
It is POSSIBLE that it be a significant TOP.
It is PLAUSIBLE that it breaks and retests.
=======================================================

AMZN Bearish Setup: Entry at $225.05 for Downside Targets!📉**Description:**
This chart outlines a **bearish trade setup** for Amazon ( NASDAQ:AMZN ) with a focus on capitalizing on downside momentum:
- **Entry**: $225.05 – Price is at a potential rejection zone below resistance.
- **Stop Loss**: Above $230.40 – Protects against invalidation of the bearish setup.
- **Targets**:
- **Target 1 (T1)**: $219.78 (red line) – Immediate support and a key short-term target.
- **Target 2 (T2)**: $211.86 (green line) – Strong secondary support for extended downside profit.
**Key Setup Details**:
- The breakdown from the ascending trendline suggests bearish momentum.
- Price rejection near $225.05 provides a favorable risk-reward ratio for this trade.
**Strategy**:
- Enter short at $225.05.
- Place a stop loss above $230.40.
- Look for profit-taking at $219.78 and $211.86.
**Why This Chart is Important**
This chart highlights a bearish breakdown opportunity in AMZN, offering a favorable risk-reward setup for short trades.
**Conclusion**
A rejection at $225.05 with targets at $219.78 and $211.86 confirms bearish momentum, making this a strategic short entry. 📉

A Charting Lesson On How Market Tops StartSee this important lesson Amazon taught many greedy traders back in the epic DotCom bubble bust.
I'm afraid, a lesson to be taught once again to many new traders (or those with short memory).
Remember, all market tops start with innocent looking corrections...

AMAZON Short after AB=CD+BB+ Fibo E levelAMAZON Short after AB=CD+BB+ Fibo E level, Target is the open gap+sma200

Technical Analysis for AMZN with GEX - Dec. 18, 2024With the broader market experiencing significant declines, Amazon (AMZN) has been no exception. Today’s drop marks a critical juncture for the stock, with implications for both short-term traders and long-term investors. Let’s dive into the technicals to uncover potential opportunities and risks.
Market Structure Analysis:
* Trend: AMZN broke below its ascending channel, confirming bearish momentum.
* Volume: A significant spike in sell volume indicates strong bearish sentiment.
* Sentiment: Current price action reflects uncertainty, with the market awaiting stability post-FOMC statements.
Supply and Demand Zones:
* Supply Zone: $227.50 – $230.00
* Demand Zone: $212.00 – $215.00
* AMZN has tested the $220.00 level, which coincides with a critical demand zone. Failure to hold here could lead to further downside.
Order Blocks and Support/Resistance:
* Key Resistance Levels:
* $225.00 (near-term resistance)
* $230.00 (major supply zone)
* Key Support Levels:
* $217.50 (recent low and demand level)
* $212.00 (strong support, aligns with prior consolidation zones)
* $200.00 (psychological level)
Key Indicators:
* EMA (9/21): The 9 EMA ($224.00) has crossed below the 21 EMA ($227.00), signaling bearish momentum.
* MACD: Bearish crossover with momentum accelerating to the downside.
* RSI: At 35, indicating the stock is approaching oversold territory.
Options Flow and Gamma Exposure (GEX):
* Call Walls: Significant resistance at $230.00 and $235.00.
* Put Walls: Strong support at $220.00 and $212.00.
* IVR (Implied Volatility Rank): 32.5, indicating moderately elevated volatility.
* GEX Insights:
* Negative gamma suggests potential for larger price swings.
* Put dominance indicates bearish sentiment.
Scalping vs Swing Outlook:
* Scalping:
* Focus on quick trades between $217.50 (support) and $225.00 (resistance).
* Use tight stops below $217.00 for risk management.
* Swing Trading:
* Potential entry at $212.00 with a stop-loss at $209.00 and targets at $225.00 and $230.00.
* If the $220.00 level holds, monitor for bullish reversals.
Actionable Suggestions:
1. Short-term bearish play:
* Entry: Below $220.00
* Target: $215.00
* Stop-loss: $222.00
2. Bounce trade from support:
* Entry: $212.00
* Target: $225.00
* Stop-loss: $209.00
3. Breakout above resistance:
* Entry: Above $230.00
* Target: $235.00
* Stop-loss: $227.00
Conclusion:
Amazon is at a critical juncture as it battles strong bearish sentiment. Key levels at $220.00 and $212.00 will determine the next directional move. Traders should remain cautious and use tight risk management in these volatile conditions.
Disclaimer: This analysis is for educational purposes only and does not constitute financial advice. Always do your own research and trade responsibly.

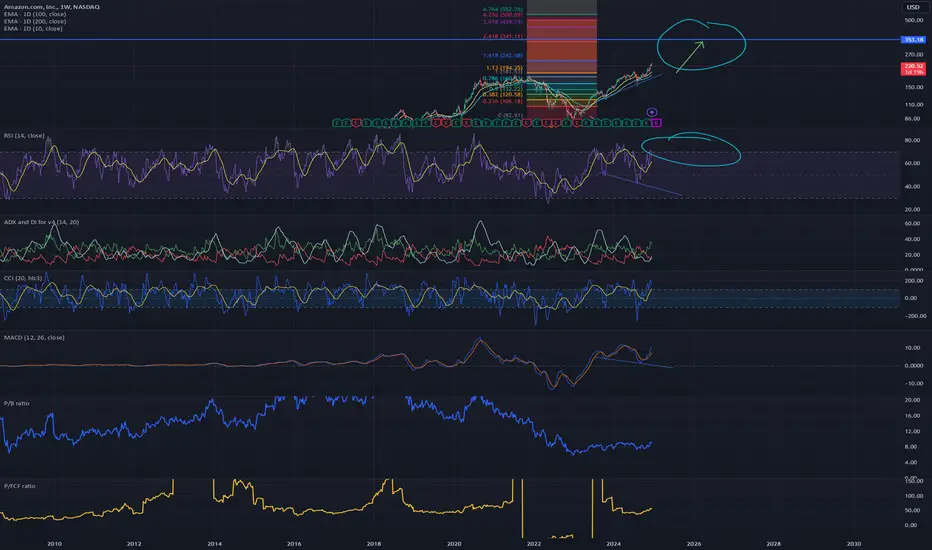
AMZN to 350While everyone is riding tesla fomo, im in Amazon at 200.
Why? Same reason I bought TSLA this April. Low P/B vs other mags and vs its own historical P/B. RSI on W shows big moves up and hidden divergence on both MACD and RSI. Free cash flow is crazy. Ecommerce is gonna be it boys. 2025 lets go. After Amazon hits the 2.618 fib at 350ish, time to rotate back to tesla. By then tesla should fall and consolidate.
$amzni will looking for to short amazon, but i will wait, its hard to but a stoploss here, maybe dayclose above the high is good and down

AMAZON ENTER 162 TP 165 AFTER EARNINGS NASDAQ:AMZN
ENTER 162 TP 165 AFTER EARNINGS
Amazon
Revenue Growth: Analysts expect Amazon’s revenues to rise 11.4% YoY in Q4 and hit a record high of $166.2 billion1. The company’s Q3 operating margin of 7.8% was the highest since early 20211.
Profitability: Amazon posted record net profits in Q3, and the metric almost hit a milestone of $10 billion1. Analysts expect Amazon to post per-share earnings of $0.81 in Q4, which is 285% higher than the corresponding quarter last year1.
Cost-cutting Initiatives: Amazon has undertaken several cost-cutting initiatives that have helped to improve its profits, despite slowing revenue growth1.
Bullish Target Price: The 210 price target from Wedbush places the firm among the most bullish for Amazon stock2. The average 12-month target price for AMZN stock from Wall Street analysts is 179, according to FactSet2.
Amazon Web Services (AWS): The top-line growth of Amazon’s enterprise-focused AWS has been gradually falling, and YoY revenue growth slipped to an all-time low of 12% in Q31. However, Amazon has stressed that the segment’s growth is "stabilizing"1.
Consumer Sentiment and Business Spending: During their Q3 earnings call, Amazon said consumers are trading down amid still-high inflation and a challenging macro environment1. It will be crucial to watch for commentary on the business spending environment in 2024

Amazon (AMZN) Stock Price Surpassed $230 for the First TimeAmazon (AMZN) Stock Price Surpassed $230 for the First Time
On 12th November, while analysing Amazon (AMZN) stock chart, we:
→ drew two ascending channels (a long-term one marked in blue and a steeper one represented by black lines);
→ anticipated a test of the $200 level as part of a correction.
According to the AMZN chart, since then:
→ the price corrected with a test of the $200 level (indicated by an arrow), aided by the median line of the blue channel;
→ it continued to climb within the mentioned channels, reaching a new all-time high — this week, the price hit $233.
Positive market sentiment is driven, among other factors, by:
→ Amazon's strong earnings report for the previous quarter;
→ expectations of a Federal Reserve rate cut, which helped the Nasdaq 100 index reach a new record, as we reported yesterday.
Can the price continue rising?
Technical analysis of Amazon’s stock chart today suggests this might be challenging because:
→ the price is near the resistance lines of both channels;
→ the RSI indicator is in the overbought zone, and you can spot a bearish divergence forming (a sign of weakening buyer momentum).
Given these arguments, the price could undergo a correction. If so, it might drop to the lower boundary of the short-term black channel.
According to TipRanks:
→ 45 out of 46 surveyed Wall Street analysts recommend buying AMZN stock;
→ on average, they predict AMZN’s price will reach $244 within 12 months.
This article represents the opinion of the Companies operating under the FXOpen brand only. It is not to be construed as an offer, solicitation, or recommendation with respect to products and services provided by the Companies operating under the FXOpen brand, nor is it to be considered financial advice.

AMZN: Are We Heading to $247 or Taking a Quick Dip First? Hey Mindbloome Family, here’s my take on Amazon (AMZN) right now:
1️⃣ If we break above $233, I think we’ll see a strong move up to $246–$247.
2️⃣ If we don’t break just yet, we could see a pullback to one of these levels first:
$225
$221
$215
From there, I’m still looking for a bounce back up to $246.
3️⃣ If we break below $215, that’s when we’ll need to pause and reassess the plan.
Wellness Tip: Don’t underestimate a good night’s sleep. Trading with a clear, rested mind makes all the difference—you’ll see the charts more clearly and make better decisions.
What’s your take—do we break through to $247, or are we dipping first? Let me know! If you want to chat more or dive deeper into this setup, check out my profile or send me a DM.
KRIS/MINDBLOOME EXCHANGE
TRADE WHAT YOU SEE

AMAZON 210 NEXT NASDAQ:AMZN
AMAZING AMAZON 210 NEXT
Recent Analyst Consensus: According to recent analyst predictions, the consensus target price for Amazon in the next 12 months is around $221.55. This would imply an increase of approximately 14.62% from the current price1. Keep in mind that this target price can vary among different analysts.
Historical Performance: Amazon has been a remarkable success story, with its stock price consistently rising over the years. It started as an online bookstore and expanded into various other sectors, including cloud computing (Amazon Web Services), entertainment (Amazon Prime Video), and smart devices (Amazon Echo).
Factors Influencing Stock Price: Several factors impact Amazon’s stock price:
Earnings Reports: Investors closely monitor Amazon’s quarterly earnings reports. Strong revenue growth and profitability tend to boost the stock.
Market Sentiment: Overall market conditions, investor sentiment, and economic trends play a role.

Amazon - This Could Be The Breakout Rally!Amazon ( NASDAQ:AMZN ) is creating a major breakout:
Click chart above to see the detailed analysis👆🏻
With this monthly candle, Amazon is finally breaking above the previous all time highs and could therefore start the next major bullish cycle. After a 5 year consolidation, a confirmed breakout will lead to an unbelievable short squeeze, which could bring us all the way up to the top of the channel.
Levels to watch: $200, $500
Keep your long term vision,
Philip (BasicTrading)

AmznTagged trendline resistance here at 230... overbought like all the other big tech..
Wont go into every overbought indicator because they are all lighting up.
Stock price hit 8% above 20sma... anything over 6 % is due for a rubberband snap back
I think in the next 2 weeks we get a pullback to 212 gap close and 20sma. I expect a bounce at 20sma.. then a grind back to trendline resistance. I highlighted how amazon can jus grind higher until major market correction or Bezo sells
I dont think we target trendline support until after earnings Q1
Smaller time frame..
Lets talk about entries.
If they give you 230 again that would be an entry or wait for a drop below 224

The key is whether it can be supported around 224.93-228.97
Hello, traders.
If you "Follow", you can always get new information quickly.
Please also click "Boost".
Have a good day today.
-------------------------------------
(AMZN 1M chart)
It is already showing an upward trend.
The point to watch is whether it can maintain the price by rising above the Fibonacci ratio 1 (238.57).
If it fails to rise, it is expected to fall to around 172.55-186.98.
-
(1W chart)
Since the BW indicator is maintained at the 100 point, even if the price rises, it will eventually show a downward trend.
Accordingly, the key is whether the price can be maintained above the Fibonacci ratio 1 (238.57).
If not, it is expected to touch the MS-Signal (M-Signal on the 1W chart) indicator.
If it falls further, it is necessary to check whether there is support near 176.77-188.07.
-
(1D chart)
The HA-High indicator is showing signs of being created at the 224.93 point.
Accordingly, if the HA-High indicator is created at the 224.93 point, the key is whether it can be supported near this point and rise above 228.97.
If it falls after the HA-High indicator is created, it is important whether it can touch the MS-Signal (M-Signal on the 1D chart) indicator and rise.
If not, it is likely to touch the M-Signal indicator on the 1W chart.
-
When the StochRSI indicator falls and maintains in the overbought zone, if it shows resistance near 224.93, it is likely to lead to further decline.
If it leads to a decline,
1st: M-Signal on the 1D chart
2nd: M-Signal on the 1W chart
You need to check whether it can be supported and rise near the 1st and 2nd above.
Therefore, when it is confirmed to be supported in the 224.93-228.97 range, it is the time to buy.
The first sell period is near the Fibonacci ratio 1 (238.57).
-
Thank you for reading to the end.
I hope you have a successful trade.
--------------------------------------------------

Trading Journal AMZN looked good as it bounced off the 50 ma, bought, sold 1/2 on the gap higher prior to earnings ( strange price action)
Sold rest prior to earnings as no profit cushion

From Prime to Subprime: Why December Could See AMZN Fall
As always, we like to keep it clean and simple, with technicals and analysis that's easy to see and understand. Let's get into it:
AMZN could see a modest correction this December. It's at an all time high, and well into two Wave 5 sequences on the 4h. It's also overbought on an least two oscillators.
We see a 5%+ correction to the $215 price range in the coming 3-4 days .
SUPPORTING OBSERVATIONS:
Recent Rapid Stock Appreciation:
AMZN has seen a significant rise, gaining 14.1% since November 29, 2024. Such swift increases can lead to overvaluation, prompting investors to take profits, supporting the reversal to $215.
Seasonal Competitive Pressures:
Ho ho ho. The holiday season intensifies competition, often leading to increased discounting and promotional activities. This can compress profit margins, potentially impacting Amazon's financial performance and investor sentiment.
Investment in New Ventures:
Amazon's substantial investment in initiatives like Project Kuiper, its satellite internet project, involves significant capital expenditure. While promising long-term, these ventures may pressure short-term profitability, causing some investors to reassess their positions.
Be alert.
Trade green.

AMZN is a straight tank heading for war.For those that know math, this is a unbeatable stock at this point in time. One of THE* best times in history to hold amazon. I sold my tesla profits for it.

AMZN Bull FlagI'm seeing a lot of bullish structure heading into CPI. Looks to me like bullish consolidation across the board, but important to note that if CPI turns us bearish that makes it even worse. For now, charts are pointing up in a big way. AMZN has been a market leader recently and has another bullish pattern here which could lead to another move up to make a new ATH soon. We have potential horizontal support here along with the lower end of the flag so the entry looks enticing to me.
