Boeing Wave Analysis – 4 March 2025
- Boeing broke the support zone
- Likely to fall to support level 153.00
Boeing recently broke the support zone between the support level 165.00 (the former monthly low from January which stopped wave B) and the 50% Fibonacci correction of the upward ABC correction 2 from November.
The breakup of this support zone accelerated the active impulse wave 1 which belongs to wave (1) from last month.
Boeing can be expected to fall further toward the next support level 153.00, which topped the previous correction 4 in December.
BA trade ideas

Breakout to the downside on BA?🔉Sound on!🔉
📣Make sure to watch fullscreen!📣
Thank you as always for watching my videos. I hope that you learned something very educational! Please feel free to like, share, and comment on this post. Remember only risk what you are willing to lose. Trading is very risky but it can change your life!

Boeing Short on Regression BreakStock market got hit on Friday and the regression break on BA might be worth follow.
I am considering this trade.

Boeing Wave Analysis – 20 February 2025
- Boeing reversed from the resistance zone
- Likely to fall to support level 177.10
Boeing recently reversed down from the resistance zone between the multi-month resistance level 187.45 (which has been reversing the price from last July) and the upper daily Bollinger Band.
The downward reversal from this resistance zone stopped the C-wave of the previous ABC correction (2) from November.
Given the strength of the resistance level 187.45 and the overbought daily Stochastic, Boeing can be expected to fall to the next support level 177.10 (low of the earlier correction ii).

Long Term Inflection Point Bull CaseMy bullish confidence comes from the 3M and 6M charts which show a much more positive price structure. What piques my interest on this timeframe is our EMA stack and the flagging nature of our short term EMAs now coiled inside our Long Term EMAs.
It make some time to play out but in regards to r/r BA has that look. If BA fails at this level and our EMAs confirm lower, we are looking at much lower.

Can Quantum Leap Us into the Cosmos?Boeing's venture into the quantum realm is not just an exploration; it's a bold leap forward into a universe where technology transcends traditional boundaries. Through its involvement in the Quantum in Space Collaboration and the pioneering Q4S satellite project, Boeing is at the forefront of harnessing quantum mechanics for space applications. This initiative promises to revolutionize how we communicate, navigate, and secure data across the vast expanse of space, potentially unlocking new realms of scientific discovery and commercial opportunity.
Imagine a world where quantum sensors offer unprecedented precision, where quantum computers process data at speeds and volumes previously unimagined, and where communications are secured beyond the reach of conventional decryption. Boeing's efforts are not merely about technological advancement; they are about redefining the very fabric of space exploration and security. By demonstrating quantum entanglement swapping in orbit with the Q4S satellite, Boeing is laying the groundwork for a global quantum internet. This network could connect Earth to the stars with unbreakable security and accuracy.
This journey into quantum space technology challenges our understanding of physics and our expectations for the future. With its history of aerospace innovation, Boeing is now poised to lead in an area where the stakes are as high as the potential rewards. The implications of this work extend far beyond secure communications; they touch on every aspect of space utilization, from manufacturing in microgravity to precise environmental monitoring of our planet and beyond. As we stand on the brink of this new frontier, the question isn't just about what quantum technology can do for space, but how it will transform our very approach to living, exploring, and understanding the cosmos.

BA 182.5 C Exp 2/14/25 (Swing setup)Will be updating throughout the week. BA broke out of the downtrend it was making, formed a weekly inverse head and shoulder pattern (neckline already broken), and the Fibonacci extension lines up perfectly. I can see BA pushing up to the 194.73 area (200 moving average) before meeting some resistance. 4HR timeframe shows a Symmetrical triangle or descending triangle pattern depending on how you want to look at it, along with a break and retest of the Daily key level, along with a fibonacci retracement sitting at the 38.2% level (strong level). Multiple confluences.
Price is currently retesting a counter trend line it made while reaching the Fib retracement level. (Will update trade later this week).

Boeing: More RoomBoeing recently climbed higher, and we still grant the magenta wave slightly more room on the upside. However, this corrective upward movement should come to an end below the resistance at $197.20 and transition into the sell-off phase of the same-colored wave . This movement, in turn, should complete the overarching turquoise wave 2 while remaining above the support at $137.03. Afterward, the price should surge beyond the resistance at $267.54, allowing the larger magenta wave (1) to conclude. On the other hand, we see a 30% chance that Boeing will form a fresh low below the $137.03 mark during the green wave alt. .

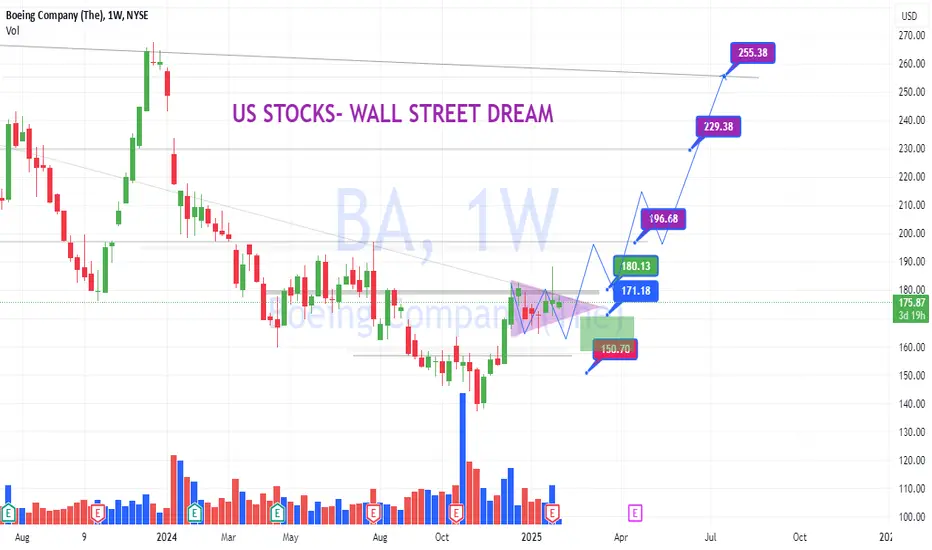
ba will still bullish till this pointsBa stock will become more bullish till these points and we will see higher high

$BA Getting Ready to Resume the Uptrend?Boeing had formed a cup with handle formation that it “tried” to breakout from at earnings. That breakout failed but not by much. It broke out again on February 6th and has since been forming what looks like a bull flag.
I had an alert set on the horizontal line of resistance (breakout area) and I took a long position with a stop just below today’s low. To confirm the continuation of the uptrend, it needs to break above the bull flag. If it does that I will look to add to my position.
This is my idea of how I look to make trades. If you like it, please make it your own trade, and follow “your” trading rules.

BA Stock Analysis: Potential Breakout and Key Resistance LevelsDisclaimer: This is not trading or financial advice, just current speculation:
BA is currently testing support at the 0.382 Fibonacci level (181.75). The RSI and MACD indicators suggest a potential breakout to the upside. If the price breaks above the current range at 182.02, it could move toward 182.59. After that, the next resistance is at 182.80, followed by a resistance zone around 182.98. The next key level to watch would be the 0.618 Fibonacci retracement at 183.40.

Boeing is still flying. BAPretty strong evidence for continuation of upward price action o this one. We are certainly waiting on a RSX momentum divergence to form here, hopefully in the upwards of 1.0 Fibonacci extension of the immediately previous move. Markets are very fluid, and as such percentage probabilities vary with time passing. What looks right today, may not look so tomorrow.

Going with Boeing!Boeing
bounce off support
uptrend
9/21 MA cross
rsi above 50 trending up
macd turning positive
break of structure
swing to 200 - 220 anyone... (took a starter yesterday, added some today)
May the Fed be with you!
NOT FINANCIAL ADVICE

Boeing (BA) Testing Critical Resistance! Breakout or Rejection?Technical Analysis (TA):
* Current Trend: Boeing (BA) is trading in an upward channel, attempting to break through the resistance zone around $182. The stock has shown strong momentum in recent sessions, supported by increased volume.
* Key Levels:
* Immediate Resistance: $182 (psychological level and near-term high).
* Support Levels: $178.19 (recent consolidation zone), $176.23 (secondary support), and $174.24 (major pivot).
* Indicators:
* MACD: Bullish momentum is fading slightly but remains positive, suggesting potential consolidation or minor pullback.
* Stoch RSI: Overbought conditions, indicating potential short-term profit-taking before another leg up.
GEX and Options Insights:
* GEX (Gamma Exposure):
* Call Resistance: Major gamma wall at $185 and $188, indicating potential hurdles for further upside.
* Put Support: Key support at $172.50 and $170, aligning with broader technical levels.
* Options Flow:
* IV (Implied Volatility): Relatively low at 10.7, suggesting that options are cheaper.
* Dominant Call Flow: Calls make up 20.1%, indicating bullish sentiment, but a breakout confirmation is needed for continuation.
Trading Thoughts and Suggestions:
* Bullish Scenario:
* Entry: Above $182 on a confirmed breakout with strong volume.
* Target: $185, then $188.
* Stop-Loss: Below $178 to manage risk.
* Bearish Scenario:
* Entry: Rejection at $182 or breakdown below $178.
* Target: $176, then $172.
* Stop-Loss: Above $183.
My Thoughts:
Boeing's price action suggests a high likelihood of testing $185 if it clears $182 decisively. The combination of a strong upward channel and positive options sentiment provides a bullish bias. However, the overbought conditions (Stoch RSI) warrant caution for a pullback before further upside.
Disclaimer:
This analysis is for educational purposes only and does not constitute financial advice. Always conduct your own research and use proper risk management before trading.

$BA Boeing C&H / IH&S / Golden Cross -Bullish Golden Cross
-Indicators Bullish
-Major 0.65 Fib Support
-IH&S / C&H
-⏰$182.55⏰⬆️⬆️

Boeing May Be Attempting a TurnaroundBoeing has struggled for years, but now there may be signs of a turnaround in the aerospace giant.
The first pattern on today’s chart is the series of lower highs between December 2023 and early December 2024. The stock has now pushed above that falling trendline, which may suggest its direction is turning.
Next, the 50-day simple moving average (SMA) just formed a “Golden Cross” above the 200-day SMA. That may also indicate a change of direction.
Third is the rally between November 22 and late December. BA retraced half the move before bouncing, which may confirm an upward trajectory.
Fourth is the weekly close of $179.99 from mid-August. The shares have been stuck at that level since December. That may make traders view a close above it as a potential breakout signal.
Recent price action has gotten more interesting as well. Last week saw an outside candle around earnings, and now an inside week is forming.
While these signals are inconclusive, they’re all potentially consistent with a reversal. Could more news of a business revival bring long-term money off the sidelines?
Finally, BA is an active underlier in the options market. (Its average volume of 127,000 contracts per day ranks in the top 5 percent of the S&P 500, according to TradeStation data.) That may help traders take position if the shares start moving.
TradeStation has, for decades, advanced the trading industry, providing access to stocks, options and futures. If you're born to trade, we could be for you. See our Overview for more.
Past performance, whether actual or indicated by historical tests of strategies, is no guarantee of future performance or success. There is a possibility that you may sustain a loss equal to or greater than your entire investment regardless of which asset class you trade (equities, options or futures); therefore, you should not invest or risk money that you cannot afford to lose. Online trading is not suitable for all investors. View the document titled Characteristics and Risks of Standardized Options at www.TradeStation.com . Before trading any asset class, customers must read the relevant risk disclosure statements on www.TradeStation.com . System access and trade placement and execution may be delayed or fail due to market volatility and volume, quote delays, system and software errors, Internet traffic, outages and other factors.
Securities and futures trading is offered to self-directed customers by TradeStation Securities, Inc., a broker-dealer registered with the Securities and Exchange Commission and a futures commission merchant licensed with the Commodity Futures Trading Commission). TradeStation Securities is a member of the Financial Industry Regulatory Authority, the National Futures Association, and a number of exchanges.
Options trading is not suitable for all investors. Your TradeStation Securities’ account application to trade options will be considered and approved or disapproved based on all relevant factors, including your trading experience. See www.TradeStation.com . Visit www.TradeStation.com for full details on the costs and fees associated with options.
Margin trading involves risks, and it is important that you fully understand those risks before trading on margin. The Margin Disclosure Statement outlines many of those risks, including that you can lose more funds than you deposit in your margin account; your brokerage firm can force the sale of securities in your account; your brokerage firm can sell your securities without contacting you; and you are not entitled to an extension of time on a margin call. Review the Margin Disclosure Statement at www.TradeStation.com .
TradeStation Securities, Inc. and TradeStation Technologies, Inc. are each wholly owned subsidiaries of TradeStation Group, Inc., both operating, and providing products and services, under the TradeStation brand and trademark. When applying for, or purchasing, accounts, subscriptions, products and services, it is important that you know which company you will be dealing with. Visit www.TradeStation.com for further important information explaining what this means.

BA: Bottom confirming and preparing for a next up cycle!BA: Bottom confirming and preparing for a next up cycle!
-Inversed HnS pattern consolidation.
-Less supply vols at the bottom.
-Key level 180 as hard resistence, upon breakingout, BA may go up strong ly!
.
Wait n see!
BA SHORTTechnicals
1. ERL>IRL
2. Correction wave ABC. Now at Wave C
3. Base which broke structure. (Green Zone)
4. Draw on liquidity. (PWL)

BA choppy price action Choppy sideways action. It seems to be setting up a bullish divergence on the daily. If it can get above 177.76 and hold then the next resistance point is 181.12. Currently it has a lot of upward buying momentum that could take it to both of those.

BOEING $BA Year Low Rejection Boeing has bounced off the Year High of 188.47, breaking structure on the 4HR. Rejecting Golden Bearish Fib levels on the Daily and Weekly, now with a negative MAC D on the 45 and soon to be 4HR… Boeing, the lagging company in the airline industry is set to reject this years low of 164 in the coming weeks…

BA Technical Analysis and GEX InsightsCurrent Overview
* Price: BA is trading at 177.90, recovering after a sharp drop in the previous session.
* Trend: Consolidating above key support levels following significant earnings-driven volatility.
* Market Note: Be prepared for potential gaps or trend shifts at market open. The levels and trends outlined here may evolve, so remain adaptable. For updates after the open, feel free to message me.
Technical Analysis
1. Key Levels:
* Support:
* 175.00: Immediate support at a prior breakout level.
* 172.50: Stronger support, aligning with a key gamma level and the 4-hour trendline.
* 167.50: Secondary support, critical for maintaining the broader uptrend.
* Resistance:
* 180.00: Major resistance and the highest gamma level.
* 182.50: A key structural resistance zone.
2. Momentum Indicators:
* MACD: Neutral to bearish, with momentum slowing after recent gains.
* Stochastic RSI: Neutralizing near mid-levels, signaling consolidation.
3. Volume:
* Strong volume on the recent pullback, indicating active trading around support and resistance zones.
4. Trendlines:
* Rising trendline from earlier lows near 172.50 provides a strong structural support.
GEX (Gamma Exposure) Insights
1. Gamma Walls:
* Call Walls:
* 180.00: The highest positive GEX and critical resistance level.
* 190.00: Significant upside target if bullish momentum resumes.
* Put Walls:
* 170.00: Strong put support, with significant negative GEX.
* 167.50: The second major support level.
2. IVR and Options Flow:
* IVR: 21.8, reflecting relatively low implied volatility.
* Calls vs. Puts: Calls make up 22.9%, indicating mixed sentiment with a slight bullish tilt.
* GEX Direction: Neutral to positive, supporting stability above current levels.
Market Direction Scenarios
1. Bullish:
* A breakout above 180.00 could trigger further upside toward 182.50–185.00.
2. Bearish:
* A failure to hold 175.00 may result in a retest of 172.50, with potential downside to 170.00.
Key Notes
* Expect potential price gaps or momentum shifts at the market open. Adjust your strategy based on real-time data and price action.
* If you need an updated analysis after the open, feel free to message me for a tailored update.

$BA Boeing Testing 2009 GP Nice move post earnings this morning, but it has now stalled and hit a strong resistance cluster=
= 2009 Fib GP
= Range VAH
= 2021 Low

BA SHORTBoeing reports will come out negative. Pricing in the earnings, and coupling it with fundamentals, we can see it
1. Raid on FVG
2. Price is moving from IRL>ERL
3. Trendline Liquidity needs to be taken out
4. Corrective pattern. Price corrects in 3 waves(A,B & C). Expect Wave C
4. Price will come to fill the base which broke overall structure to the upside.
