Bear ConfirmationThe stock has broken out of the ending diagonal and successfully retested the lower boundary trendline.

COST /LONG D1/WCasco is still in an upward trend in the upper half. It is trying to fill the gap. It is above the moving averages. And the moving average 20 is below the rest and one side up. My good friend. I would be happy if you follow me and leave me a comment.


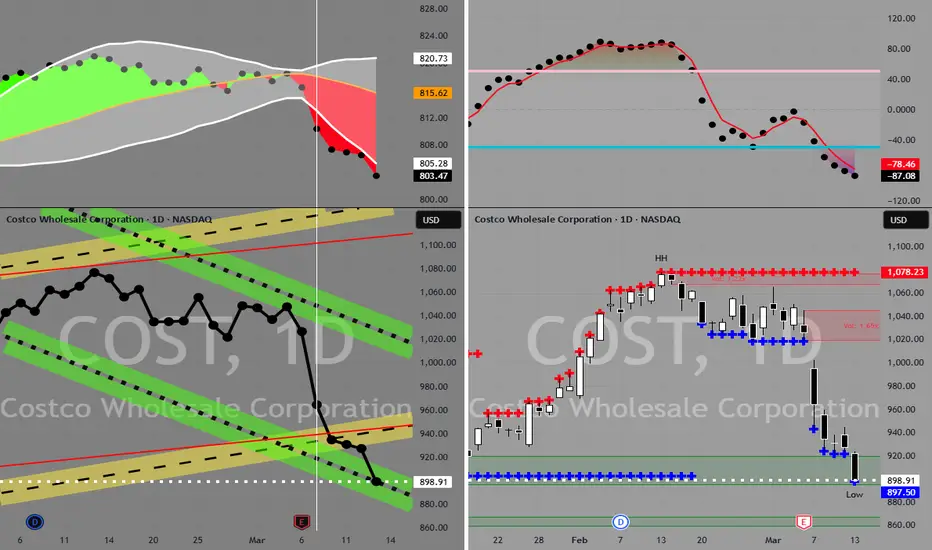
Reversal Pattern Triggered, Key Levels in FocusCostco has formed a clear Head and Shoulders pattern within an ascending channel that supported price action since late 2023. The recent break below the neckline suggests a potential trend reversal and opens the door for a deeper correction.
Price has broken the lower boundary of the channel and is

COSTCO: Massive rebound on the 1W MA50 can go for +45% profit.Costco has just turned bullish on its 1D technical outlook (RSI = 56.966, MACD = -6.590, ADX = 35.211) as it's on the 3rd straight green week ever since it touched and held the 1W MA50. This rebound, though not an absolute bottom on the 2 year Channel Up, is the new technical bullish wave of the pat

COST in Buy ZoneMy trading plan is very simple.
I buy or sell when at three of these events happen:
* Price tags the top or bottom of parallel channel zones
* Money flow spikes beyond it's Bollinger Bands
* Stochastic Momentum Index (SMI) at near oversold overbought level
* Price at Fibonacci levels
So...
Here's
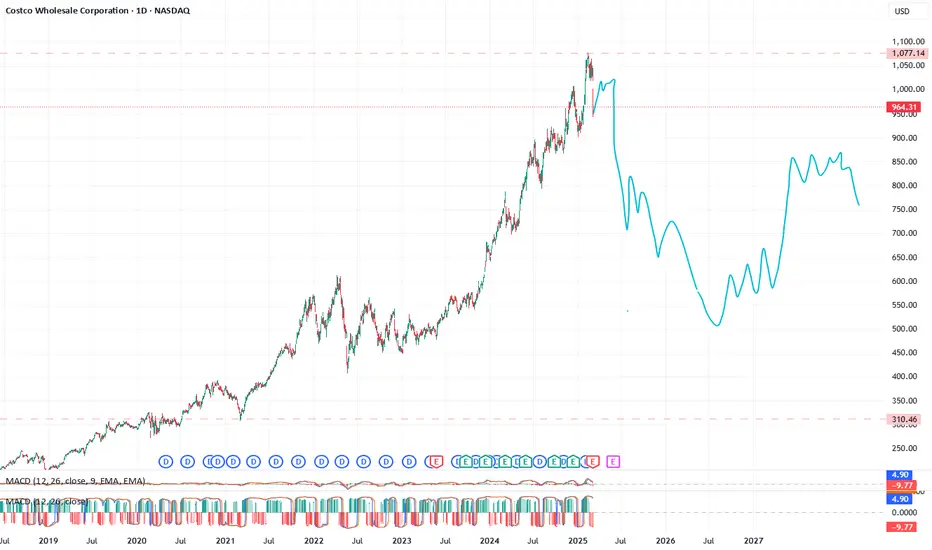
COST to come down in about 6 monthsA bounce after this current dip, then retracement back down to lower levels
Long very short term, but in a downward trend
COSTCO Power HouseWatching Costco going up to $1004 in order to see reaction time for either bullish or bearish.
Costco is well structured and definitely a good investment m, but current sentiment could break Trend support.
Up for 1004 for reaction. Very short term buying opportunity for now. Probably a 1 day move

Breaking: COSTCO Shares Dip 2% In Premarket Amidst Earnings MissCostco Wholesale Corporation (NASDAQ: NASDAQ:COST ), together with its subsidiaries, engages in the operation of membership warehouses in the United States, reported fiscal second-quarter sales that topped analysts’ estimates, but earnings missed as costs rose.
The membership-based retailer saw re

COST Costco Wholesale Corporation Options Ahead of EarningsIf you haven`t bought COST before the rally:
Now analyzing the options chain and the chart patterns of COST Costco Wholesale Corporation prior to the earnings report this week,
I would consider purchasing the 1030usd strike price Puts with
an expiration date of 2025-3-21,
for a premium of approxim

See all ideas
Displays a symbol's price movements over previous years to identify recurring trends.
Curated watchlists where COST is featured.
