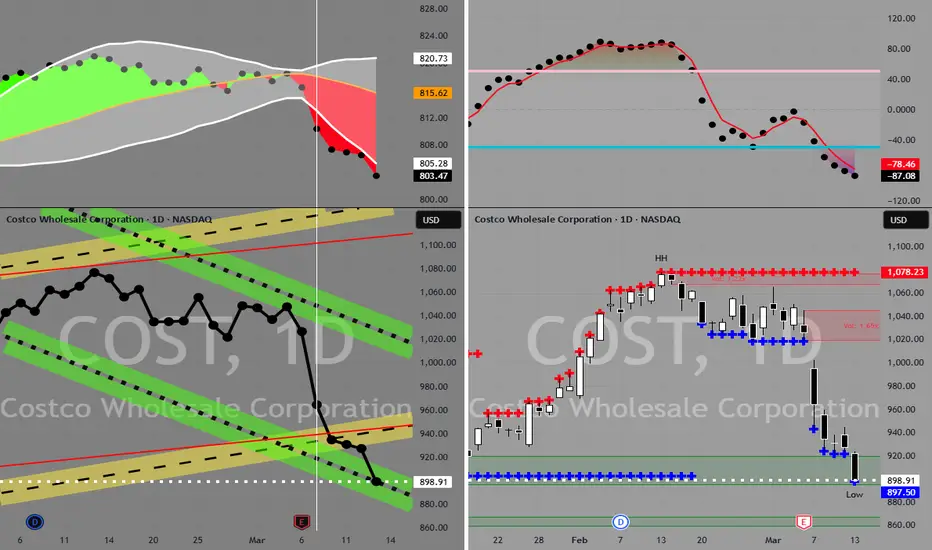
Bear ConfirmationThe stock has broken out of the ending diagonal and successfully retested the lower boundary trendline.
COST trade ideas

COST /LONG D1/WCasco is still in an upward trend in the upper half. It is trying to fill the gap. It is above the moving averages. And the moving average 20 is below the rest and one side up. My good friend. I would be happy if you follow me and leave me a comment.


Reversal Pattern Triggered, Key Levels in FocusCostco has formed a clear Head and Shoulders pattern within an ascending channel that supported price action since late 2023. The recent break below the neckline suggests a potential trend reversal and opens the door for a deeper correction.
Price has broken the lower boundary of the channel and is currently trading around $916.48. If bearish momentum continues, key support levels to watch are:
🔹 $876.47 – first reaction zone after the breakdown.
🔹 $788.38 – intermediate support.
🔹 $713.76 – measured move target from the H&S pattern.
The bearish outlook would be invalidated with a sustained recovery above the $1,000 area.
📉 Bearish bias remains as long as price stays below the neckline and inside the descending structure.

COSTCO: Massive rebound on the 1W MA50 can go for +45% profit.Costco has just turned bullish on its 1D technical outlook (RSI = 56.966, MACD = -6.590, ADX = 35.211) as it's on the 3rd straight green week ever since it touched and held the 1W MA50. This rebound, though not an absolute bottom on the 2 year Channel Up, is the new technical bullish wave of the pattern. We've had so far 2 main +45.14% price surges in the past two years. We estimate that to be the 3rd and last up until the end of the year. Go long, TP = 1,270.
See how our prior idea has worked out:
## If you like our free content follow our profile to get more daily ideas. ##
## Comments and likes are greatly appreciated. ##

COST in Buy ZoneMy trading plan is very simple.
I buy or sell when at three of these events happen:
* Price tags the top or bottom of parallel channel zones
* Money flow spikes beyond it's Bollinger Bands
* Stochastic Momentum Index (SMI) at near oversold overbought level
* Price at Fibonacci levels
So...
Here's why I'm picking this symbol to do the thing.
Price in buying zone at bottom of channels
Stochastic Momentum Index (SMI) at oversold level
Money flow momentum is spiked negative and under at bottom of Bollinger Band
Entry at $898
Target is upper channel around $1000
COST to come down in about 6 monthsA bounce after this current dip, then retracement back down to lower levels
Long very short term, but in a downward trend
COSTCO Power HouseWatching Costco going up to $1004 in order to see reaction time for either bullish or bearish.
Costco is well structured and definitely a good investment m, but current sentiment could break Trend support.
Up for 1004 for reaction. Very short term buying opportunity for now. Probably a 1 day move before watching reaction.

Breaking: COSTCO Shares Dip 2% In Premarket Amidst Earnings MissCostco Wholesale Corporation (NASDAQ: NASDAQ:COST ), together with its subsidiaries, engages in the operation of membership warehouses in the United States, reported fiscal second-quarter sales that topped analysts’ estimates, but earnings missed as costs rose.
The membership-based retailer saw revenue rise 9% year-over-year to $63.72 billion, above the analyst consensus from Visible Alpha. However, Costco's net income of $1.79 billion, or $4.02 per share, missed expectations, despite rising from a year earlier. The results came as merchandise costs rose 9%.
The period marked the company’s second quarter since its membership fee hike went into effect in September. Revenue from membership fees rose 7% year-over-year to $1.19 billion, though executives previously said they expect the impact on margins to be weighted to the back half of the fiscal year and into fiscal 2026.
Technical Outlook
Shares of Costco slid 1.5% in after-hours trading Thursday following the release extending the lost to premarket trading hours, with the asset down 2.02% in Friday's premarket session.
For Costco shares, the immediate support lies within the 1-month low axis. Should Costco shares face selling pressure the 1-month low should serve as a point of reprieve for Costco shares. With the RSI at 50 a breakout above the 1-month high should spark a bullish reversal for Costco shares respectively.

COST Costco Wholesale Corporation Options Ahead of EarningsIf you haven`t bought COST before the rally:
Now analyzing the options chain and the chart patterns of COST Costco Wholesale Corporation prior to the earnings report this week,
I would consider purchasing the 1030usd strike price Puts with
an expiration date of 2025-3-21,
for a premium of approximately $22.15.
If these options prove to be profitable prior to the earnings release, I would sell at least half of them.

Selling Premium Going into Costco EarningsGiven Costco’s historical tendency for minimal post-earnings stock movement, along with inflated IV in the options market, selling premium via a bear call spread is a high-probability, risk- managed strategy to profit from an expected IV crush and minimal price movement following earnings.
Key Points Supporting the Thesis:
1. Historical Price Movement: Over the past 4 years, Costco’s stock has experienced an average post-earnings price movement of only 1.24%. The majority of moves have been within a modest range of -1% to +2%. This indicates that despite earnings announcements, the stock tends to remain within a predictable price range, minimizing the potential for significant directional price swings.
2. Implied Volatility and Overpricing of Options: Currently, the options market is pricing in a 4.6% move for Costco’s stock post-earnings. Given Costco’s historical price movement patterns, this is an overestimation of potential volatility. IV tends to collapse after earnings announcements.
3. Costco’s High Valuation: Costco is currently trading at a P/E ratio of 61, which is significantly higher than historical levels. This suggests that the stock is already expensive relative to its
earnings potential, making it less likely to experience a massive upward movement after earnings. The high valuation also means that even strong earnings may not drive significant upside, further increasing the likelihood of a muted post-earnings reaction.
4. Earnings Catalysts and Market Behavior: Costco’s earnings reports historically have had limited impact on the stock’s price due to the company’s stable revenue and earnings growth.
Investors have already priced in much of the growth potential, leading to minimal surprise reactions to earnings releases. The combination of low historical price movement and high IV makes this a prime environment for selling premium, as the likelihood of large moves is low, while option prices remain high.

Implied Volatility Action For CostcoSorry no video today but, I am looking at Costco For an earnings play in options. I'll be targeting the 20 delta calls end the week of their earnings and I will be exciting the day of earnings (they accounted after market close). The idea here is that theta decay will be out weighed by implied volatility.
The chart itself is showing strength but, the daily has a potential anti pattern setting up. So knowing when we are incorrect is imperative.

Buy Costco Wholesale CorporationShort Term Trading Advice by Naranj Capital
Buy Costco Wholesale Corporation
● Buy Range- 1035 - 1050
● Target- 1101 - 1110
● StopLoss- 1010
● Potential Return- 5-6%
● Duration- 12-14 Trading Days

Costco Wave Analysis – 25 February 2025
- Costco reversed from support level 1025.00
- Likely to rise to resistance level 1080.00
Costco recently reversed up from the support level 1025.00 (which stopped wave iv at the start of February) intersecting with the 20-day, moving average and the 38.2% Fibonacci correction of the upward impulse from January.
The upward reversal from the support level 1025.00 stopped the previous minor correction 2, which belongs to wave (5) from December.
Given the clear daily uptrend, Costco can be expected to rise to the next resistance level 1080.00 (top of the previous impulse wave 1).

Costco Wholesale: Robust Earnings Support Bullish Trend◉ Technical Observation
● The stock price is exhibiting a strong uptrend, moving within an ascending parallel channel.
● A recent breakout from a rounding bottom pattern has propelled the price higher, nearing the upper boundary of the channel.
◉ Two Possible Scenarios
1. Rejection and Pullback: The price may face resistance at the upper end of the channel, leading to a potential decline.
2. Breakout and Continuation: Alternatively, the price may break through the upper boundary, sustaining the uptrend and driving the stock higher.
◉ Q1 FY25 Result Highlights
● Net Income: Up 13.1% to $1.79 billion, compared to $1.58 billion in Q1 FY24.
● Comparable Sales: Increased by 5.2% in the US and 5.8% in Canada.
● E-commerce: Comparable sales soared by 13%, with adjusted e-commerce comparable sales rising to 13.2%.
● Membership Revenue: Grew by 7.8% to $1.166 billion, reflecting strong customer loyalty.
● Gross Margin: Improved by 24 basis points to 11.28%.

COST, Short, 4h✅ COST is overbought and is pulling back to retest the key support at 1007.80 before determining its next move.
SHORT 🔥
✅ Like and subscribe to never miss a new analysis! ✅

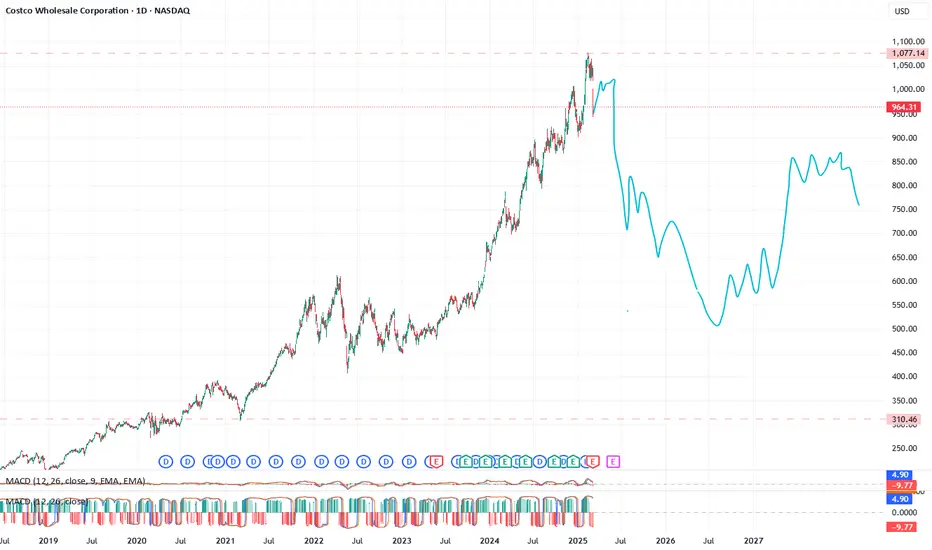
COST Short and LongI am bearish on Cost for now until we get into major support below. I wont be buying until the $500 to $350. I cant see the future and we might blow through this resistance and go higher, but I would love to get long in the next year or two if we ever see a retrace down. Short play for now.
$758 would be my target for shorts and a very bullish entry. Confluence between my fib method and it is an untested level.

COSTCO - Time to break above and beyond the All time HighHi guys , today we are going to overview one of the retail giants COSTCO.
Fundamentals :
Revenue Growth and Profitability :
Consistent Revenue Growth: Costco has demonstrated steady revenue growth, driven by an expanding membership base, increased same-store sales, and international expansion.
Profit Margins: While Costco operates with low gross margins due to its focus on low pricing, its operating margins benefit significantly from recurring membership income. This structure ensures financial stability even in competitive environments.
Financial Health:
Balance Sheet Strength: Costco has a strong balance sheet with manageable debt levels and ample liquidity. Its ability to generate robust free cash flow supports both operations and shareholder returns.
Dividend Growth: Costco pays a reliable dividend, which has seen consistent growth over the years. Additionally, the company occasionally issues special dividends, highlighting its commitment to returning value to shareholders
Valuation Metrics:
Price-to-Earnings (P/E) Ratio: Costco often trades at a premium valuation compared to peers due to its consistent performance and strong brand equity.
Price-to-Sales (P/S) Ratio: Reflecting its robust revenue generation capabilities, Costco’s P/S ratio is higher than the retail industry average but supported by predictable growth.
And some potential risks : Thin Margins: Costco’s low-margin strategy leaves little room for error, and rising costs (e.g., labor, logistics) could pressure profitability.
Economic Sensitivity: While generally resilient, Costco could face challenges if economic conditions significantly impact discretionary spending or if competition intensifies.
Foreign Exchange Risk: With international operations, Costco is exposed to currency fluctuations that could affect earnings.
Technical analysis : The company has been running on a very healthy uptrend throughought 2024 and has had 4 green earning seasons which gives a positive bullish trend conversion,with analysists focusing on another green earnings in their Q4 report this gives us the necessary confirmations for a up-trend:
Entry has been made at : 921
Target will be above the ATH : 1030
As always my friends happy trading!
P.S. If you have questions or inquiries about one of my existing set-ups or personal questions / 1 on 1 sessions consider joining my community so you can follow up with me in private!

Costco Wave Analysis – 4 February 2025
- Costco broke round resistance level 1000.00
- Likely to rise to resistance level 1050.00
Costco is rising inside the minor impulse wave 3, which previously broke the key round resistance level 1000.00, which stopped wave i at the start of December.
The active impulse wave 3 belongs to the higher order impulse wave (3) from the start of August.
Given the strong daily uptrend, Costco can be expected to rise to the next resistance level 1050.00 (target price for the completion of the active impulse wave 3).

COSTCO: Bullish Continuation in Play – Targeting 1,017$NASDAQ:COST is trading within an ascending trendline, suggesting a continuation of the bullish trend. The price recently bounced off the trendline support, confirming buyers’ control. This structure indicates the potential for further upside, with the next target around the 1,017 level.
The bullish scenario assumes that the price maintains its momentum and respects the trendline support.
Let me know your thoughts or if you have an alternative perspective!

US Stocks After Tariffs This WeekThe following US stocks are attracting money flow as scanned and detected by Option Scalper on Daily Candle:
1. IBM
2. ABBV
3. COST
4. META
5. WMT
6. ACN
7. V
8. MA
9. ABT
10. DIS
The following stocks are witnessing selling pressure:
1. NVDA
2. CVX
3. MSFT
The indicator was fed with top 40 US Stocks (by market cap) and this scan is based upon this input. You can change the stocks you want to monitor by going to indicator settings.
The stocks which are shown in gray color are currently in the cloud area (consolidation zone) and hence not tradeable (on daily candle).
Please use your due diligence before making your trading decision.
Happy trading this week.

Speculative Madness: The Market’s Bubble Stocks Some stocks areSpeculative Madness: The Market’s Bubble Stocks
Some stocks aren't just overvalued—they're in full speculative bubble mode. Fundamentals? Irrelevant. When euphoria takes over, rationality disappears.
Here’s my list of bubble stocks that scream unsustainable pricing:
SBUX, T, PLTR, BMY, PYPL, NFLX, GS, ISRG, ARM, C, SHOP, BSX, SPOT, UBS, IBKR, RELX, CEG, CRWD, MSTR, MMM, DASH, COF...
And let’s not forget the obvious: TSLA, META, AMZN, AVGO, GOOGL, JPM, MA, V, WMT.
Honestly, the entire banking sector, brokers, and tech are in bubble territory.
What the hell is going on with this market? Why are algos just buying, buying, buying, squeezing all the shorts?! Unbelievable.
The dump will be insannnnnnnne!!! 🚨

Costco Wholesale Corporation (COST) SL-$931,88 TP-$999,80Technical Analysis:
-Historical pattern
-Support within a channel and trend indicator
-One day left until the monthly candle closes, and a daily engulfing candle is a likely sign they will attempt to surpass the previous high
