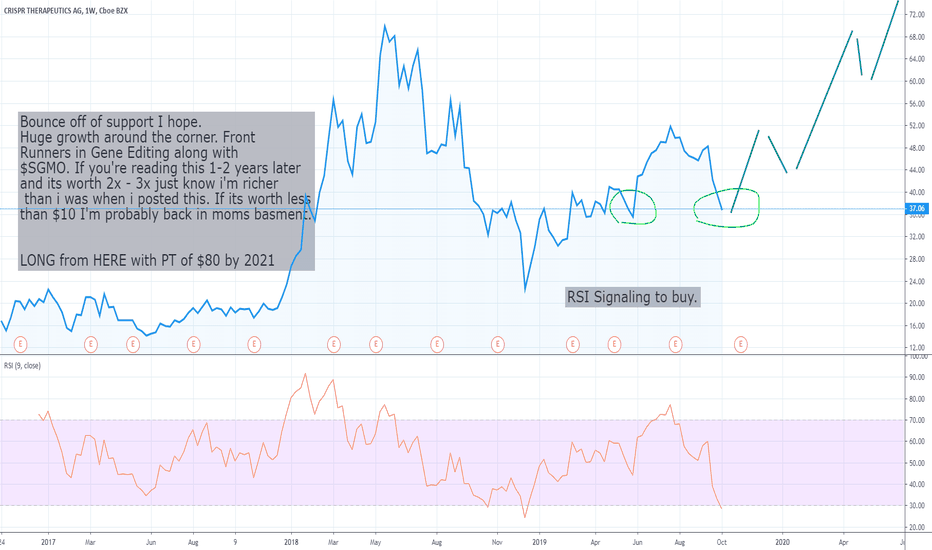
CRSP - Crappy stock or Bullish Harmonic possibilities up?CRSP has been beaten up recently, yet the time for selling may be behind us now. Please look at the green long term channel that we are in now. Notice the green buy and sell signals indicated with the small ellipses.
Next lets take a look at the possible black up channel, that indicates a faster slope for us.
If we see price break higher as shown by the green arrow, at 53.90, then we know that the black channel is in play.
Next lets look at some of the harmonic patterns that may be in play.
First up is the Gartley pattern. We should see price reach the 78.6% retracement of the brutal sell off. Please see the red pattern. Typically after that area is reached, we expect a 38-62% pullback. However if the black channel is in place, I'd be thinking we would only get a small 38% pullback as shown by the pink "possible" trail drawn.
Next could be the Deep crab pattern as shown in purple. This uses the first 86% bounce of the brutal sell off as a measuring stick to indicate which pattern to look for, and the Deep Crab fits the bill nicely.
Next, let's take a big picture point of view and look at the whole sell off. Looking at the recent bounce to the ideal 61.8% zone (as shown with the green pattern) we can expect a nice long run to the 161.8% extension using the Crab pattern. .. Very nice....
So lets see if these harmonics give us a clue as to the possible turning points (based on price-not time) as each pattern completes, we can expect a pullback to shake out the traders that can't believe how good CRSP stock price is doing...
CRSP trade ideas
CRSP - ascending fib channelWatching this one. Many stocks have entered this parallel channel pattern since the beginning of 2019.
Fib channel shows good heartline support.
It all depends on what happens with the financial system and stock market in general, but nice swings have been playing out here.
100% Buy Signal on CRSPThe Megalodon indicators are giving us a buy signal on CRSP Therapeutics! The backtesting results are 100% on this stock so don't miss out on these profits!
The Megalodon indicator uses a machine learning algorithm, combined with data from over 500 buy setups, and over 2000 indicators to produce extremely accurate buy signals on any and all asset classes! You will also receive real time buy and sell signals for the stock market, cryptocurrency, as well as forex markets! We also busy completed our cryptocurrency automated trade bot. It trades for you, using our backtested indicator with phenomenal results! So try it today!!!
Is CRSP going to "technically" break the bear trend this weekIn my previous post on #CRISPR I talked about the Green upward sloping trendline & how every time CRSPR has traded on or below it since May 2017 we've seen parabolic action.
I don't want to say I told you so, but we've seen some parabolic action.
To my surprise, the parabolic movement came the news of Vertex upfront payment of $175 million upfront payment. Specifically, Vertex gets worldwide rights for CRISPR/Cas9 technology along with other items such as AAV vectors for DMD and DM1. This deal totals just about $1 billion when you factor in all milestone payments for these programs, plus royalties.
Moving on to the chart now..
It appears as though CRSP is about to "technically" breakout of the bear trend which started in May 2018 after reaching ATH's.
The blue downward sloping trendlines are the attached to the swing highs, and one has already been broken to the upside, which could be considered the first real confirmation of a trend reversal. Once the second blue downward sloping trendline is broken to the upside CRSP is "technically" out of the bear trend, IMO.
Time will tell per usual.
CRSP continues to gain LONG With some investor conferences and earnings coming there is a good chance that CRSP can significantly pop up out of the channel again, or at least continue its upward trend.
I expect it to move into the new zone between $40.06 and $47.08 within a month and if it crosses over to remain above.
If it touches the ichimoku cloud I will back off as I can see it dropping or flattening out for a while if that is the case, but only waiting for it to clear above the cloud and continuing its climb to $50 usd.
Please like, share, or follow for more tips as I get better it is only going to get hotter!
Just missed itUgh... had a limit order which missed by $0.25 last week, and never got filled. Now look at CRSP today.
People dream of scenarios like this today, as they can make YEAR profits in one day. I'm pissed I missed it. Congrats to those who did.
I'll be watching from the sidelines, as I expect massive profit taking occurring this week.


