$DOCU is heading to $265-$300NASDAQ:DOCU
As long as there’s any lockdowns happening and as more people realize DocuSign is way quicker for signing docs, it’s not a “stay at home” trade, it’s the new normal.
DOCU trade ideas

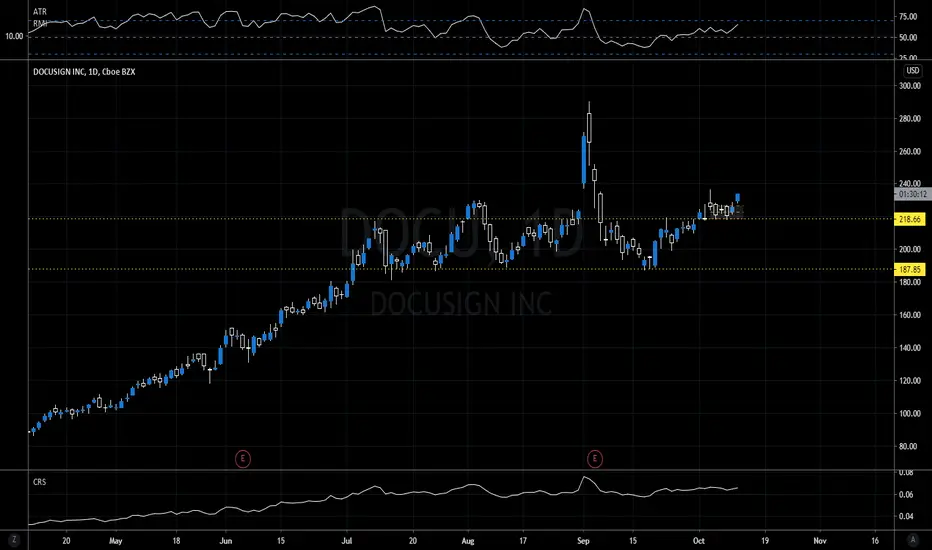
Fib channel gives path to 255Taking a different approach with this one and seeing how accurate the fib channel will prove to be. Whether a fib channel or not, price has been traveling in this channel with some exceptions bottoming out or breaking out. Overlaying volume profile indicates its about to find a base over 228-230 and may make its next move from there.

DocuSignOuch! Missed a huge opportunity on November 10th at the 187 price level. It is hitting the RSI 70 area around 205 / 208. Could break through. Would hold for now. Would sell if RSI > 75 level. Not a good entry point. Too late.

Docusign Must Buy for Long Term: USA Docusign Must Buy for Long Term: USA
A Profit & Solutions Strategy

DOCU_testingbottoms DOCU is neutral with possible entry in a couple days while it tests some bottoms during a channel for 5 months....possibly a good entry before earnings

DOCU LongDemand Zone below sideway.
Next 170 demand is a better entry point.
Entry 193
Stop 183
Target 236; RRR = 4:1
I am not a PRO trader. I need few months to practice trading strategies.
If you like this idea, please use SIM/Demo account to try it, until my trading plans get high winning rate.

DOCU$DOCU is consolidating, if the price stays above $237 then it will test $250. There will be selling at this point. On the other hand, if the price goes below $237, it has a potential to go down to $205 support then go back up to $225 (inside the triangle).

wow another perfect call xDDOCU congrats to those who got in this on my last idea! wow did exactly as i predicted. now we are looking for a dip around 200-210. or if it continues higher we target 280-285 on a break of 250.leave a like if you found this helpful <3

DOCUSIGN INC TO WATCH FOR 4% UP TO 15% RETURNDOCUSIGN INC to watch for a potential 4% at $245 up to 15% RETURN at $270.
Look for chart for full description


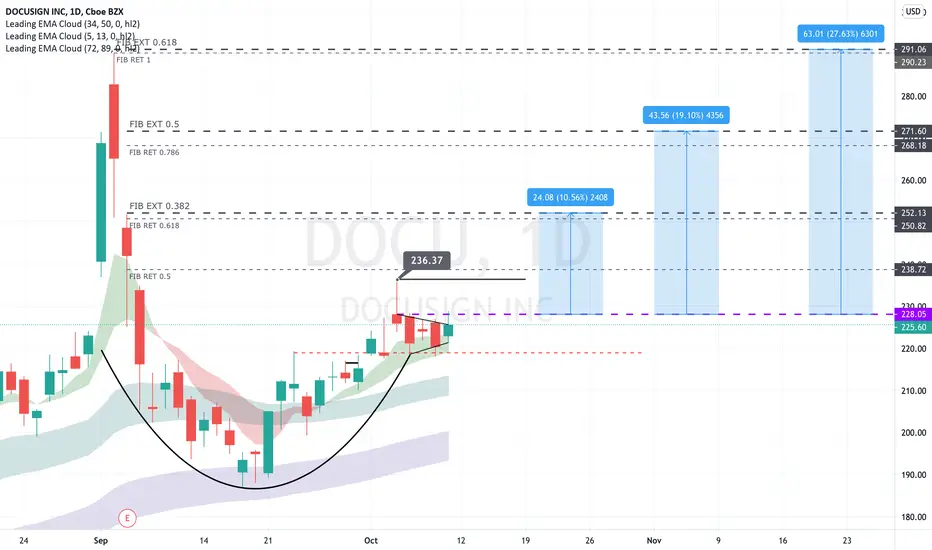
Cup and handle, primed for a big moveA strong name recently that has consolidated over the past week and a half with some sharp moves up that were not held. A break should yield a large move. Major and minor fibs marked above.
DOCU consolidatingGood RSI. It is resisting the market uncertainty, and consolidating into a posible uptrend.

Docus already b4 Elliott Wave 3, abc limted by ConfluenceLooking on the chart in 1D, the leg down appears like an "a", so Docusign still could be in correction mode.
But the orange line is the highest Confluence Zone (for 1D), with its typical power to catch corrections from falling down
to regular exytensions. (As described in my confluence script) .
If you switch to 2h, you see that most of the downswing from 5 is an "a", probably of a zig zag - and the c wave is caught and chopped by the orange line.
So i guess that to 85% likeliness, the stock is already at the end of 2 - ready for 3, the next impulse up.

DOCU, Aroon Indicator entered an Uptrend on October 20, 2020Over the last three days, Tickeron A.I.dvisor has detected that DOCU's AroonUp green line (see chart) is above 70, while the AroonDown red line is below 30. When the green line goes above 70 while the red line stays below 30, this is an indicator that the stock could be poised for a strong Uptrend. For traders, this could mean going long the stock or exploring call options in the next month. Tickeron A.I.dvisor backtested this indicator and found 198 similar cases, 177 of which were successful. Based on this data, the odds of success are 89%. Current price $219.71 is above $215.68 the highest resistance line found by Tickeron A.I. Throughout the month of 09/18/20 - 10/20/20, the price experienced a +17% Uptrend, while the week of 10/13/20 - 10/20/20 shows a -4% Downtrend.
Bullish Trend Analysis
The Momentum Indicator moved above the 0 level on September 25, 2020. You may want to consider a long position or call options on DOCU as a result. Tickeron A.I. detected that in 24 of 35 past instances where the momentum indicator moved above 0, the stock continued to climb. The odds of a continued upward trend are 69%.
The Moving Average Convergence Divergence (MACD) for DOCU just turned positive on September 28, 2020. Looking at past instances where DOCU's MACD turned positive, the stock continued to rise, Tickeron A.I. shows that in 20 of 25 cases over the following month. The odds of a continued upward trend are 80%.
DOCU moved above its 50-day Moving Average on September 25, 2020 date and that indicates a change from a downward trend to an upward trend.
The 10-day Moving Average for DOCU crossed bullishly above the 50-day moving average on October 02, 2020. This indicates that the trend has shifted higher and could be considered a buy signal. Tickeron A.I. detected that in 5 of 8 past instances when the 10-day crossed above the 50-day, the stock continued to move higher over the following month. The odds of a continued upward trend are 63%.
Following a +5.59% 3-day Advance, the price is estimated to grow further. Considering data from situations where DOCU advanced for three days, in 143 of 164 cases, the price rose further within the following month. The odds of a continued upward trend are 87%.

DOCU possibly forming a H&SNASDAQ:DOCU looks to be starting the formation of the right shoulder.
If we complete the formation, look to short under $187.
H&S invalidated when we close over $230.

$DOCU DocuSign rises on Upgrade
DOCU Makes a 2% move afterhours after getting initiated with a BUY rating and $290 price target from UBS.
Next major target is now $250. - $255 above which the chart opens up to $275.00


nice chart requestcould either see a big impulse and hit 300 within a couple weeks, or just continue on a small uptrend. either way calls should payout :) goodluck !

$DOCU - New Up Trend?I have been in and out of $DOCU the last couple of weeks. It's been a difficult hold. However, I'm looking to get back into this name on the long side if it can hold at least 2/3's of today's gain going into the close. It appears to me that we now have a series of higher highs and higher lows since the pullback. Ideas, not investing / trading advice.


DOCU first target 234, second one 238DocuSign is looking to reach first 234, which is pretty close based on the chart. The second target is 238.