Google bounces from supportGoogle bounced from a support level and is currently above ema. If it can sustain above the ema for April close, it can be a positive sign for google. Not a trading advice, just sharing my analysis.
GOOG trade ideas

GOOGL Technical Analysis (1H)Trend: Short-term bullish channel developing
Price: $157.09
Structure: Price is currently grinding upward inside a rising channel with support around $150 and resistance near $159.50.
Key Support & Resistance Levels:
* 🔽 Support: $150.04 → confluence with lower trendline and previous demand zone
* 🔼 Resistance: $159.51 → upper trendline, testing prior intraday rejection level
Volume: Rising steadily with every test of the lower channel support—buying pressure is evident.
RSI: Slight bullish momentum but approaching mid-range (not yet overbought)
🎯 Trade Idea:
* Bullish Scenario: If price breaks and closes above $159.50 with volume, the next leg toward $162–$165 is possible.
* ⚡️ Entry: $158 breakout
* 🎯 Target: $162.50 / $165
* 🛑 Stop: $155
* Bearish Scenario: A breakdown below $155 may trigger a move toward the $150 and $144 zones.
* ⛔️ Entry: Below $154.80
* 🎯 Target: $150 → $144
* 🛑 Stop: $158
🔥 Options GEX & Sentiment Insights
IVR/IVx:
* IVR: 70.6 (elevated, traders are pricing in movement)
* IVx Avg: 58 → implies option prices are above historical norm
Options Flow:
* Puts: 27.1% dominance (moderate hedging activity)
* GEX Bias: Strong Gamma Wall at $157, suggesting price may gravitate toward or stall here unless a breakout occurs.
* Call Walls:
* $160 – Mild resistance
* $162.5 – Potential profit-taking zone
* Put Walls:
* $150 – Strong support area due to GEX negative cluster
* $145–$140 zone – Loaded with high negative GEX: bounce likely if it dips there
⚠️ GEX Highlight:
* The Highest Positive NETGEX is near $157, suggesting market makers prefer pinning price near this zone unless there's a volatility jolt.
💡 Final Thoughts & Strategy
GOOGL is currently in a tight spot where price is climbing within a narrowing channel, and the GEX walls are aligning perfectly around it. It’s a gamma-neutral zone where market makers may suppress volatility short term unless external catalysts break the structure.
Scalp Idea: Use break/retest around $157 or $160 for quick directional trades.
Options
Strategy:
* Neutral-to-Bullish: Consider selling a put credit spread above $150 if expecting price to consolidate.
* Directional Call: Buy 0DTE or 2DTE calls if price breaks above $159.50 with volume.

GOOGL Tariff Relief dips to buy: $156.76 ideal, 150.00 possible GOOGL got sold in panic then bought in fomo.
We of the Fib Faith indulge in logical serenity.
We plan and execute calmly and deliberately.
$156.10-156.76 Bounce would indicate strong bull.
$150.55-150.84 is a Must-Hold or it was a bull trap.
$168.17-170.00 should be an achievable first target.
===============================================

goog to dropgoog weak of m-a and expecting to drop. d1.15
Testing out new quicker strategy lets see how it goes Phi

GOOGLE 4/8/25I want GOOG @ $134-140 range.
Rejected today along w most the market on trying to rebound from tarriff talk and Monday's FUD.
Still like 134-140 range as next entry. Hold out till then

Google may rotate up soon - Bearish exhaustion maybe?NASDAQ:GOOGL is looking at a possible short-term recovery after the stock has shown significant bearish exhaustion. 1.) Prices dip below the key support with spike in volume. Suspected manipulation or bear trap. 2.) the whole corrective move since Aug 2024 is in a bearish corrective flat structure. Meaning to say, that the stock may find its major support at 123.6% extension of the previous day range.
While stochastic is showing potential signs of oversold and DM- is peaking. so anytime from now, we are looking for strong opportunity to buy. Key clue, if the stock rally 6-8% within a day, we are looking at a possible recovery.

Trump tariffs 2018 vs 2025Based on the Google stock chart, I believe that large corporations reflect the overall economy more than their individual financial strength.
History:
January 2018: The U.S. imposed tariffs ranging from 30% to 50% on imported solar panels and washing machines. 
March 2018: Tariffs of 25% on steel and 10% on aluminum imports were enacted, citing national security concerns. 
June 2018: The steel and aluminum tariffs were extended to include imports from the European Union, Canada, and Mexico.
July 2018: The U.S. imposed a 25% tariff on $34 billion worth of Chinese goods, initiating a trade conflict with China. 
August 2018: An additional 25% tariff was applied to another $16 billion of Chinese imports.
September 2018: The administration implemented a 10% tariff on $200 billion worth of Chinese goods, with plans to increase it to 25% by January 2019. 
May 2019: The tariff on the $200 billion of Chinese goods was increased from 10% to 25% after trade negotiations stalled.
August 2019: President Trump announced plans for a 10% tariff on an additional $300 billion of Chinese goods, which were later adjusted, with some products facing a 15% tariff starting in September 2019 and others delayed to December 2019.


Google, SP&500, Netflix. Just a theoryJust a theory. Technical analysis of global markets based on 3 assets.
Nothing more to say, because this is a theory.

OptionsMastery: Looks like a good buy on GOOGLE!🔉Sound on!🔉
📣Make sure to watch fullscreen!📣
Thank you as always for watching my videos. I hope that you learned something very educational! Please feel free to like, share, and comment on this post. Remember only risk what you are willing to lose. Trading is very risky but it can change your life!

GOOG Simple Short TradeCRACK!
GOOG has now broken a key area with the potential to have a huge move down.
This is a very simple trade with great risk/reward.
Bulls!! Caution is in order!!

Alphabet ($GOOGL) Nearing Completion of 5-Wave DeclineIn our latest Elliott Wave analysis of Alphabet ( NASDAQ:GOOGL ) on the 30 minute chart, we observe a clear 5-wave impulse structure unfolding to the downside, originating from the February 5, 2025 peak. This decline aligns with the broader corrective pattern, and we believe NASDAQ:GOOGL is now in the final stages of this bearish move before a larger recovery takes shape. Let’s break down the structure and what to expect next.
Wave Structure Breakdown
The chart below illustrates that NASDAQ:GOOGL reached a significant high on February 5, 2025, at 209.51.
From this peak, the stock initiated a 5-wave impulse decline:
- Wave ((1)): The first leg down concluded at 156.72, marking a sharp initial decline from the February 5 high.
- Wave ((2)): A corrective rally followed, retracing part of the decline and peaking at 171.28, completing wave ((2)) as the 30 minute chart below shows.
- Wave ((3)): The decline resumed with wave ((3)), which extended lower to 150.66.
- Wave ((4)): A counter-trend rally unfolded in a 3-wave structure, labeled (W)-(X)-(Y) on the chart, reaching a high of 159.23 on April 3, 2025, as indicated on the chart. This peak marked the completion of wave ((4)).
- Wave ((5)): The current leg lower began after the April 3 peak at 159.23. As of the latest data on April 3, 2025, NASDAQ:GOOGL has reached 152.76, as shown on the chart, and appears to be in the final stages of wave ((5)).
Current Position and Invalidation Level
The chart highlights an invalidation level at 171.34 (the “RIGHT SIDE+” line in red). As long as NASDAQ:GOOGL remains below this level, the bearish outlook for wave ((5)) remains valid. With the current price at 152.76, wave ((5)) is likely approaching its conclusion soon. It should not go below 138.7, otherwise wave ((3)) will be the shortest wave. Alphabet (GOOGL) 30 Minutes Elliott Wave Chart
What’s Next: A Larger 3-Wave Rally
Upon the completion of wave ((5)), we expect NASDAQ:GOOGL to initiate a larger 3-wave corrective rally. This should be end a higher-degree wave b. The rally should unfold in a 3-wave pattern (A-B-C) and could target a retracement toward the 170.6 area, where prior wave ((2)) levels may act as resistance.

GOOGL Testing Key Support: Breakdown or Bounce from $150?
🧠 Macro Context:
In the wake of the Trump tariff announcement, market-wide risk aversion hit big tech hard. GOOGL is now sitting on a crucial $150 gamma support zone, where both technical and options flow converge. The market is indecisive: is this a base or a trap?
📊 Technical Analysis (1H Chart)
Market Structure:
* GOOGL has been in a consistent downtrend, rejecting lower highs.
* Attempted recovery stalled at the HVL around $152.50, and now price is back down to support near $150.66.
* The short-term trendline from the late March breakdown has held, acting as dynamic resistance.
Key Levels:
* Support:
* 🔻 $150.66 = Recent session low
* 🔻 $149 = PUT wall / breakdown risk zone
* Resistance:
* 🔺 $152.50 = HVL rejection zone
* 🔺 $155 = First GEX resistance area
* 🔺 $160 = Massive Gamma Wall / Call Resistance
Indicators:
* Selling volume continues to be elevated.
* No real sign of divergence or bottoming pattern yet, but price is coiling near a gamma pivot.
🧨 GEX & Options Flow Analysis
GEX Map (Options GEX ):
* GEX: 🔴🔴🔴 — heavy short gamma positioning means dealers are sellers into strength, adding fuel to downside momentum if $150 breaks.
* Highest Net Positive GEX / Call Wall sits around:
* $160–162.5 = Gamma resistance cluster
* Put Support:
* $150–149 = Highest PUT density. A break below could trigger dealer hedging flows, accelerating losses.
Options Oscillator:
* IVR 75.3 → Elevated risk expectations.
* IVx 40.6 avg vs 3.48% daily → Volatility is rising but hasn't spiked.
* PUT$ 0% → Either the data is delayed or retail isn't hedging — could mean more downside is possible.
🧭 Trade Scenarios
🐻 Bearish Breakdown Setup:
* Trigger: Clean break below $150.60 with volume
* Target: $149 → $147.50
* Stop: Above $152.50 (tight control)
* Edge: GEX confirms no real support below $149
🐂 Gamma Bounce Setup:
* Trigger: $150 holds and price reclaims $152.50
* Target: $155 → $160 (scalp to swing)
* Stop: $149 breakdown
🔥 Summary:
GOOGL is coiled at the gamma pivot zone ($150). If it breaks, the lack of strong PUT interest and dealer short gamma could trigger a fast move down to $147 or lower. On the flip side, a strong bounce and reclaim of $152.50 can open up a path toward $155–$160.
⚔️ Suggested Plays:
🔻 Buy $150P 0DTE/2DTE on breakdown — ride momentum
🔺 Buy $155C 1-week expiry only if $152.50 is reclaimed with strength
Stay nimble — we’re in a gamma battlefield.
Disclaimer: This is not financial advice. Trade your own plan, manage your risk, and stay objective.

GOOGL - bears taking controlhi traders,
GOOGL ready for more downside.
The monthly time frame is pretty straightforward here.
Huge bearish engulfing is almost confirmed.
STOCH RSI with a bearish cross.
It's a time to retest the 50 simple moving average.
Bears will drag the price towards 135$ where we should see some bounce.
Lower prices are coming.
Check out our SPX analysis:

The analysis focuses on the short-term to medium-term timeframe.The analysis focuses on the short-term to medium-term timeframe.
Tug-of-War Between Bulls and Bears: At the current price of 157.04, the market is in a tug-of-war between buyers (bulls) and sellers (bears).
Bulls are defending key support levels near 152.48 (Fibonacci 100% retracement of Wave C) and 154.34 (Expanded Flat target). A hold above these levels could signal a potential reversal.
Bears are attacking resistance levels at 160.31 (Fibonacci 100% projection of Wave C) and 162.82 (Expanded Flat target). A break below 152.48 could accelerate downward momentum.
Recent Price History: The market has been in a downtrend recently, with the price dropping from 191.18 (July 10, 2024) to 157.04. Key Fibonacci levels (e.g., 161.8% retracement at 159.84) and Elliott Wave patterns (e.g., Diagonal Ending Downward Candidate) have guided this decline. Momentum indicators (e.g., RSI at 47.51) suggest the downtrend may be losing steam, but the MACD histogram turning positive hints at a potential short-term bounce.
Current Sentiment (Technical & News):
Technical Indicators: Mixed signals. RSI (47.51) is neutral, while MACD shows a bullish crossover (histogram turning positive). The price is below key moving averages (e.g., 200-day SMA at 167.35), indicating a bearish bias.
News Sentiment: Mixed to slightly negative. Ad revenue pressures and regulatory risks weigh on sentiment, but long-term growth catalysts (AI, cloud) provide optimism. Analysts maintain a "Buy" rating despite near-term challenges.
Synthesis: The technical picture aligns with the news—short-term bearishness (price below MAs, ad revenue concerns) but potential for a reversal if support holds (undervaluation, bullish MACD).
Key Levels & Momentum:
The price is currently below the 50-day SMA (161.89) and 200-day SMA (167.35), signaling bearish dominance.
Momentum is fading (RSI neutral, Stochastic not oversold), but the MACD histogram suggests a possible short-term bounce.
2. Elliott Wave Analysis (Contextualized to Current Price)
Relevant Elliott Wave Patterns:
Diagonal Ending Downward Candidate (Valid): Suggests the downtrend may be nearing completion, with Wave 5 potentially ending near 152.48-154.34 (Fibonacci 100% projection).
Expanded Flat Upward Candidate (Potentially Valid): If the price holds above 152.48, this pattern could signal a corrective rally toward 162.82.
Wave Count vs. Indicators/Sentiment:
The Diagonal Ending pattern contradicts the bearish news sentiment but aligns with oversold technicals (RSI, MACD). This divergence suggests a potential reversal if support holds.
The Expanded Flat pattern would confirm a bullish reversal if the price breaks above 160.31.
Near-Term Projections:
Downside: A break below 152.48 could extend losses to 148.36 (161.8% Fibonacci projection).
Upside: A hold above 152.48 and break above 160.31 could target 162.82 (Expanded Flat target) and 167.35 (200-day SMA).
3. Strategy Derivation (Realistic, Actionable NOW, News Considered)
Primary Strategy: WAIT (due to conflicting signals).
Why Wait? The technical setup is mixed (bullish MACD vs. bearish MAs), and news sentiment is neutral-to-negative. The upcoming Q1 earnings could add volatility.
If Price Holds Support (152.48-154.34):
BUY with confirmation (e.g., break above 160.31).
Entry Zone: 154.34-156.13 (Fibonacci 78.6% retracement).
Stop-Loss: 151.44 (below recent low).
Take Profit: TP1 at 160.31 (Fibonacci 100%), TP2 at 162.82 (Expanded Flat target).
Risk/Reward: ~1:2 for TP1.
If Price Breaks Below Support (152.48):
SELL with confirmation (e.g., break below 150.06).
Entry Zone: 152.48-151.44.
Stop-Loss: 154.34 (above support).
Take Profit: TP1 at 148.36 (161.8% Fibonacci), TP2 at 145.90 (Wave 5 projection).
News Context Check:
Earnings uncertainty and ad revenue pressures favor caution. Reduce position size if trading.
4. Trade Setup (Actionable, Realistic, News Aware)
Direction: WAIT (watch key levels).
Key Levels to Watch:
Upside: 160.31 (breakout confirmation).
Downside: 152.48 (breakdown confirmation).
News Reminder: Be mindful of Q1 earnings and ad revenue trends.
5. Summary Section
✅ Investor / Long-Term Holder Summary:
Key Support: 152.48 (accumulation zone if held).
Long-Term Outlook: Undervalued (DCF: $260 vs. $157). Focus on AI/cloud growth.
Action: Wait for pullback to 152.48 or break above 167.35 (200-day SMA).

GOOGL eyes on $150: tight Fib cluster around the psych levelGOOGL and the magnificent seven trying to find support.
This one just hit a tight cluster of 4 fibs around psych val.
$150.66- 150.96 is the exact zone of interest for bulls.
==================================================
.

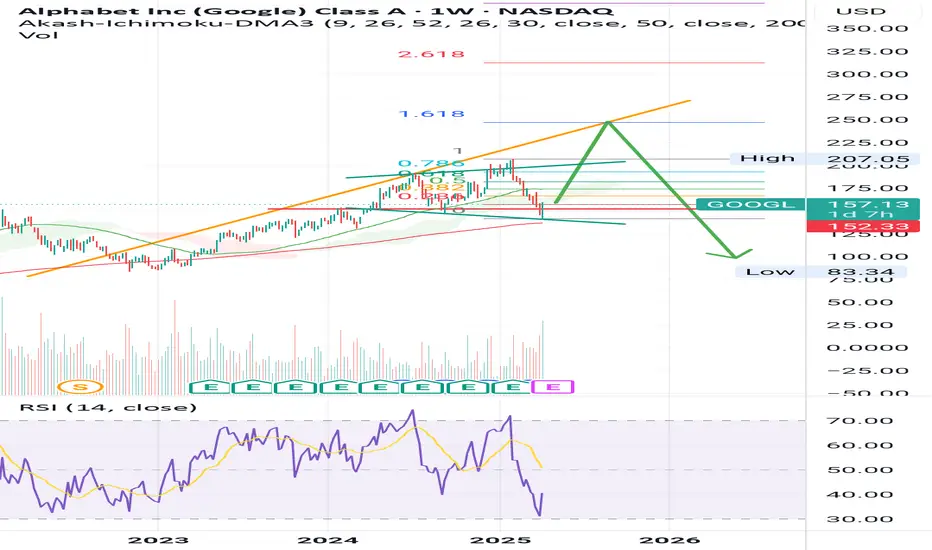
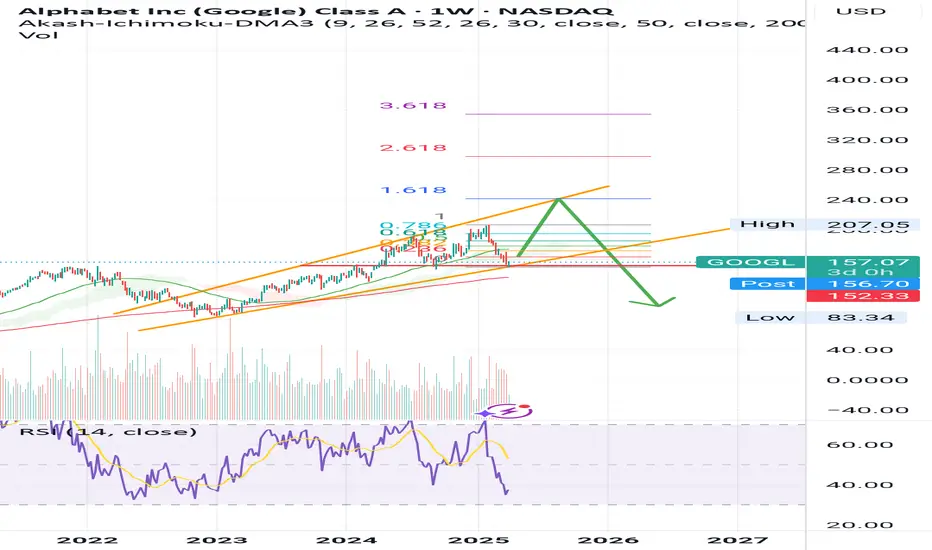
GOOGL - Melt up & Crash series [3]Decided it is an expanding megaphone bearish instead of a parallel channel.
Most important thing is level (fib 1.618).
Rest are just predictions to estimate timings via intersections. Hopefully this is the low and next wave is up.
Not financial advice.
GOOGL - Elliott Wave Final ShowdownGOOGL has dropped over 27.28% , reaching a minor profit-booking zone. The $150 level serves as a key demand zone, where a potential price reversal could occur. The formation is either expanded flat or a running flat on the daily timeframe chart.
Confirmation is best observed near the lower trendline of the parallel channel. If bearish momentum persists, prices may decline further to the $142-$140 range before a strong rebound. Once the correction ends, the upside targets are $168, $180, and $195.
A new low will form if the previous low is breached. Further research will be uploaded soon.

Let's tryJust a tecnical analysis opinion. Retracement in a good long trend and maybe a good price to buy.

GOOG looks appetizing at this levelGOOG at this value is hard to come by. From what I'm seeing, GOOG is undervalued and it has reached some support at its current level. BRB gonna feast on this treat while others fear.

Alphabet (GOOGL) Stock Hits 2025 LowAlphabet (GOOGL) Stock Hits 2025 Low
As seen on the Alphabet (GOOGL) stock chart, the price has dropped close to $156—a level not seen since September 2024.
Since the start of 2025, the stock has fallen by more than 18%.
Why Is GOOGL Falling?
As mentioned earlier today, overall market sentiment remains bearish due to the White House’s tariff policies.
For Alphabet (GOOGL), the situation has worsened today due to the following developments (as reported by the media):
➝ Google has admitted liability and agreed to pay $100 million in cash to settle a US class-action lawsuit accusing the company of overcharging advertisers, according to Reuters. Alphabet shares dropped 4.4%.
➝ Google’s division was found guilty of anti-competitive behaviour in India related to its app store billing system.
Technical Analysis of Alphabet (GOOGL)
In February, we noted investors’ negative reaction to the company’s earnings report, which led to a bearish gap (marked by a red arrow).
Since then, bears have maintained control, pushing the price below the lower boundary of the ascending channel that had been valid since 2023. Key signals include:
➝ The $170 level (near the bearish gap on 10 March) acted as resistance on 25 March.
➝ Bears showed little reaction to bulls at the $160 level and have kept the price contained between two downward-sloping red lines.
Bears may now be targeting the psychological level of $150. If bulls want to maintain control over GOOGL’s long-term uptrend, they need to take action soon.
This article represents the opinion of the Companies operating under the FXOpen brand only. It is not to be construed as an offer, solicitation, or recommendation with respect to products and services provided by the Companies operating under the FXOpen brand, nor is it to be considered financial advice.

144-147 range, I will accumulate more of Google sharesThis is not financial advice.
From chart , you can see it has dropped more than 25% from its peak and I expect more price falls to the level , 144-147 . Here, I would be happy to accumulate more.
