Alphabet, buy opportunity Uptrend
GOOG is inside an uptrend and after passing of 134, pullback back has been ended and there are two good bullish candle as a trigger for buying. I suppose 131 or 126 can be good places for setting SL.
GOOG trade ideas

GOOGL, Moving In Steady Trend, Potential To Continue Further!Hello Traders Investors And Community And welcome to this analysis where we will look at recent events, the current price-structure and what we can expect the next time from GOOGL. As we saw the major lows this year after the corona-crisis-breakdown we had a price-recovery in GOOGL to the point at which we are now. Regarding the digitalization boom, we currently experiencing worldwide we can come to the conclusion that GOOGL is the major data-kraken in the world collecting data from users worldwide and therefore a leading organizational pillar in the new artificial intelligence technology which relies on big data to function and counter possibilities this is giving GOOGL fundamental ground to sustain further even in the current crisis and the high digitalized technological world we live in. On the technical side, I found some interesting signs which can determine the further outcome of GOOGL and lead to some decent opportunities therefore we are looking at the 4-hour locals timeframe.
As you can see in my chart GOOGL is moving in a steady trend within this rising-channel that is marked in blue within my chart, currently it is approaching a huge gap which will be closed at the 1480 level that you can see marked in green and black in the chart. As you can examine also GOOGL confirmed above the EMA-structure we have here and is a leading part of the uptrend in which it is trading, therefore when we break it to the downside this will cause bearish pressure as this signal validated already positively in the past of GOOGls history. As for now there are two possible options for the stock to continue further, once it is that we get a bullish move as soon as we will the gap which can be possible after such gap and the second will be that we confirm the 1480 level after the gap filled as resistance, both scenarios are tradable and after the proper scenario has confirmed rightly we can enter the market.
Now counting everything together we have a higher potential to continue bullish as there are important support levels in the range and we are moving within a steady uptrend that bullish scenario will be fulfilled when the stock confirms above the 1480 level and continues to rise, after that level we will approach the current all-time-high level which will be a huge test for the stock. When considering the bearish side which isn't more likely at the moment it is possible that the stock falls below the lower boundary of the channel which will cause bearish pressure to the downside when we close also below the EMA structure in the chart a new downtrend and therefore logical reversal has been formed the next important support, in this case, will be at the 1310 level, either case can be traded rightly after the confirmation has emerged.
Comparing the stock within the real-economy we have definitely a fundamental growth potential because there is an increase in digitalization as more and more people rely on online-infrastructure in the current crisis in which the stock plays a big role, this trend can go further when we do not get any important signs which will invalidate this growth. What we need to keep in mind is that this can possibly change as we get second lockdown restrictions in many countries and therefore a second corona-fear on the market which will hit the global economy similar to the first phase with all majors stocks and indices going down as this can be just a whole bull-trap, in this case, we need to look forward to be prepared when this happens and just don't rush into trades or buy anything because there are still rumors according in the corona-crisis which can hit the markets.
In this manner, thank you for watching, support for more market insight have a great day and all the best!
Information provided is only educational and should not be used to take action in the markets.

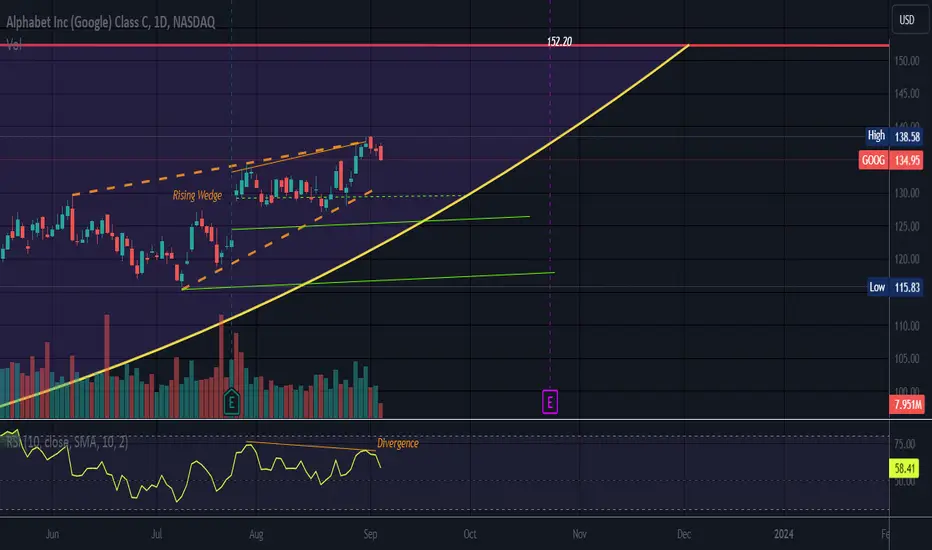
Googl Correction incoming..
Rising wedge here.
Looking for a correction back to 127 in the coming weeks, after that, a dead cat bounce to retest wedge follow by the real move down to
113-116 . Should Look something like this

RSI Divergence/Rising WedgePrice was trying to form a cup but a bearish rising wedge has formed.
The bottom line has not been broken so this wedge is not valid.
Previous support levels can catch a rising wedge if the bottom line is broken.
But eventually it will be broken
No recommendation.
The party may end soon so grab your designated driver (o:
part 2 QQQ SPY & 7 Mega Cap Tech Stocks ForecastSupport and resistance guide QQQ SPY & 7 Mega Cap Tech Stocks Forecast

Google Long IDEAI can see a new ATH for this stocks , my top down analysis shows that we should break the high

+50%A massive profit driver for the company, this is the main ingredient in making Google a safe investment. Nearly 90% of Google's earnings and revenues come from search. These profits and revenues fund the projects Google hopes become future profit centers.

GOOGL LongAlthough market pulling back, GOOGL has been holding this bull pennant, looking for this to breakout in either direction for the next $10 move.
127 LIS
If 127 is lost we can retest 116-120
If 131 is taken out we can head to 137-140

GOOGL with a strong upward breakthrough this weekGOOGL with a strong upward breakthrough this week
This chart shows the weekly candle chart of Google stock over the past year. The graph overlays the bottom to top golden section at the end of 2022. As shown in the figure, Google stock tested the bottom of the chart against the 2.618 position of the golden section three times in July and last week, with a strong upward breakthrough this week! The recent pressure level of Google stock is the 3.000 level at the bottom of the graph above the golden section, which is likely to suppress the market's rise! Google stock is likely to significantly retreat in the future, at least testing the 2.000 position of the golden section in the chart!

Google -> Trading The Major Swings...Hello Traders and Investors ,
my name is Philip and today I will provide a free and educational multi-timeframe technical analysis of Google 💪
Just a couple of months ago Google stock perfectly retested a major monthly bullish trendline and in confluence with a retest of the 0.618 fibonacci level we already had a major rally of more than 50% towards the upside.
If you are looking at the weekly timeframe you can also see that Google stock just broke above and retested the strong psychological $125 level and everything is looking massively bullish.
Finally I am now just waiting for another retest of the daily $132 level and after some bullish rejection everything is pointing towards more bullish upside.
Keep in mind: Don't get caught up in short term moves and always look at the long term picture; building wealth is a marathon and not a quick sprint📈
Thank you for watching and I will see you tomorrow!
My previous analysis of this asset:

Rising WedgePrice is at the top line of a rising edge which is often resistance.
Rising Wedges are considered Bearish But are not valid until the bottom line is broken.
Rising wedges can get squeezed to the upside or the downside but as a rule, price will come back down to break the bottom line at some point in the future.
Both lines slope up and narrow at the apex. Rising Wedges represent too much supply within and are often caused by FOMO.
No recommendation.
There is also a possible RSI divergence.

Long ALPHABET Hello,
There is a good Signal to go long with alphabet Google Stock, and it could hit the target of 151 point

GOOGLTapped monthly supply zone today. Pretty bullish price action all year but we'll see if it's enough to push through supply.

GOOGL: Buy ideaBuy idea on GOOGL as you see on the chart after the breakout with force the resistance line and the vwap indicator.Thanks.

Predicting Google Stock for longtermMy prediction for Google Stock in the long term (based on the weekly chart) is as follows: Google Stock is currently trading above the $125 support level. However, if it successfully breaks through the neckline, it may reach the $170 price level, resulting in a 40% gain. Conversely, if it fails to hold above the support level around $125, it could drop to the next support level at $101, resulting in a loss of 20% to 30%. I have identified the best entry point as whenever the price enters the white shaded corridor. It's important to note that this is not financial advice to buy, hold, or sell. This is merely my personal prediction for my own use, and I am sharing it with the community for educational purposes only.
Thank you

Part 2 long term OUTLOOK - QQQ SPY and 7 Mega Cap Tech StocksPart2 long term OUTLOOK - QQQ SPY and 7 Mega Cap Tech Stocks

Google Long term analysis More likely is another sub-wave 5 up to complete Wave III before the big correction. And after big Wave V to 150 -160.

GOOG shortGOOG broke out of this range box 2nd time to the downside .....now break of this recent consolidation can results in the good downside move for GOOG

Google 180, 1D Bullish Inverted Head & Shoulder will retrace from 125.2
134 above Inverted Head & Shoulder Activation
Target 180
Weekly Above 9 EMA 126 Supper Bullish
Check Daily 9 EMA Pattern Activation

Google is coming to its weekly demand zonegoogle recently broke out of its weekly downtrend , it also broke its recent weekly supply zone.
there's a trading opportunity of long at 108 $ (weekly demand )
target would e 138 .
DYOR befoe intevesting

free $GOOG 17 days in the box.Google been accumulating in the box for 17 dayys, this is such a great 17 set up because just like NASDAQ:RIVN when its free, there will a decent extension. i am more bearish on this set up and and i hope we test the bottom of the box tomorrow, but anything can happen in the market so always play offense as well. 126 is my main target price if we get free.

GOOGL relative strength and key concepts. NASDAQ:GOOGL has been showing impressive relative strength on a weak tape.
Still just watching here. #nasdaq being oversold and ready for a dead cat bounce doesn't mean risk is low. We dont want the lower price, we want the best price
More on NASDAQ:GOOGL as it's a fascinating example of key concepts like relative strength, high volume up vs low volume down, pocket pivots, VCPs, bounce on support, shakeout of weak hands, early turn, etc. All pointed on chart.

The fifth wave will beginHello friends
It seems that the fourth wave is being completed and the fifth wave will begin. Macdi shows that there is a heavy negative divergence and then wave 5 of the fall is coming.
