Alphabet (GOOGL) Stock Drops 10% – What's Behind the Decline?Alphabet (GOOGL) Stock Drops 10% – What's Behind the Decline?
As the stock chart for Alphabet (GOOGL) shows, on 4 February, the share price reached a historic high above $205. However, despite surpassing analysts’ expectations, GOOGL shares dropped sharply after the earnings report was released:
→ Earnings per share: actual = $2.15, forecast = $2.12
→ Gross revenue: actual = $187.8 billion, forecast = $187.3 billion
As a result, GOOGL's current price is approximately 10% below its all-time high. Market sentiment may have turned negative due to several factors:
→ Cloud revenue fell short of expectations, raising concerns about Alphabet’s ability to compete in the rapidly evolving AI sector.
→ Weaker-than-expected advertising revenue from Google, Alphabet’s core business. While advertising revenue grew by 10.6% to $72.46 billion in Q4 2024, analysts had anticipated a 12% increase.
→ Alphabet announced plans to significantly increase capital expenditures next year to around $75 billion, prompting questions about the impact on depreciation and profitability.
Additionally, news that China has launched an antitrust investigation into Alphabet—potentially in response to tariffs imposed on Chinese goods by the Trump administration—may have weighed on the stock price.
Technical Analysis of Alphabet (GOOGL)
GOOGL remains within an upward trend channel (marked in blue on the chart), with the price having pulled back to key support levels, including:
→ The lower boundary of this trend channel
→ The $180.90 level, marking the top of the bullish gap from 10 December
→ The psychological level of $180, which acted as resistance in late 2024 (indicated by arrows)
This suggests that the downward momentum caused by the earnings report could slow down or even reverse, meaning the current price action may be a pullback within the prevailing uptrend.
Should You Buy GOOGL Stock Now?
According to a report from The Smart Investor via Yahoo, investors should not be overly concerned, as:
→ Alphabet's strong cash flow will allow it to fund its planned $75 billion in capital investments without issue.
→ The company’s leadership stated that demand for its AI-driven products currently exceeds supply.
Meanwhile, analysts surveyed by TipRanks believe Alphabet can overcome its challenges:
→ 27 out of 37 analysts recommend buying GOOGL, with none advising to sell.
→ The 12-month average price target for GOOGL is $215.85.
Overall, while short-term volatility remains, long-term prospects for Alphabet appear solid. Investors with a longer time horizon may see this dip as a buying opportunity.
Trade on TradingView with FXOpen. Consider opening an account and access over 700 markets with tight spreads from 0.0 pips and low commissions from $1.50 per lot.
This article represents the opinion of the Companies operating under the FXOpen brand only. It is not to be construed as an offer, solicitation, or recommendation with respect to products and services provided by the Companies operating under the FXOpen brand, nor is it to be considered financial advice.
GOOG trade ideas

Multi-Confluenced Buy Area (GOOGL)GOOGLE’s weekly chart is STACKED with confluences. I’ll live with any loss after such a signal. For starters there’s a Jeanius Buy on the weekly. This is signal is being printed a key area with many confluence factors (listed below).
- Multi-Demand Area test that has been tested about 15 times.
- Break and Retest of a supply area
- Longterm uptrend that has been tested 4 times.
- A weekly fair value gap that has been 14.29% filled.
- Weekly break of structure and retest
- Long term and short term trend alignment
- Price has reclaimed the 50MA after previously closing below
- Weekly Larkuidity Sweep (sweeping 2 untested lows with a volume of 374.107M) … volume bar exceeded average
- Sitting within the golden zone of a weekly fib retracement
- Bounce from oversold area of RSI
- A weakness in sellers are displayed

Spread Triple Bottom BreakdownTriple bottoms highlighted in yellow.
Short entry at $183.10
Profit target $160
SL $189.20
I'll be looking at the GOOGL $182.50 Put 2/28 which is currently $2.39.

$GOOG with a bullish outlook following its earnings #StocksThe PEAD projected a bullish outlook for NASDAQ:GOOG after a negative over reaction following its earnings release placing the stock in drift C with an expected accuracy of 100%.

$GOOG week of feb10thGoogl rejected prior day open
190 seems to be key level , hold above calls , reject below puts

Google trading planHi traders what is your opinion on Google?as you can see it creates bearish flag for the second time the first one fails,are you expecting the second one to fails too or breakdown or continuation of the trend,this is very tricky ok, but simple to follow,weekly candlestick close lower as you can see let's findout whats next,I won't mind talking some buys from this trendline support followed by tight stop looses,yes it can breakdown and that will give alot of people's chances to take a long buy,however it's not going to easy one,as we have to make tough decisions from the current zones meaning it can bounce bek from current price or fall,that will be more than 10% if it continues to fall soo you can also expect some pull back after this drop for earning report,soo its up to you this is my trading plan.


Google Gapping Down. GOOGLWhen gaps occur in an overstretched market in the opposite direction to the trend, these tend to become areas of resistance and do not get filled. Here, the price action prior to the gap flipped the VZO, BB %pct and Ehlers StochRSI. Adding fuel to the fire, vWAP and US are in tandem acting like resistances to downward price action.

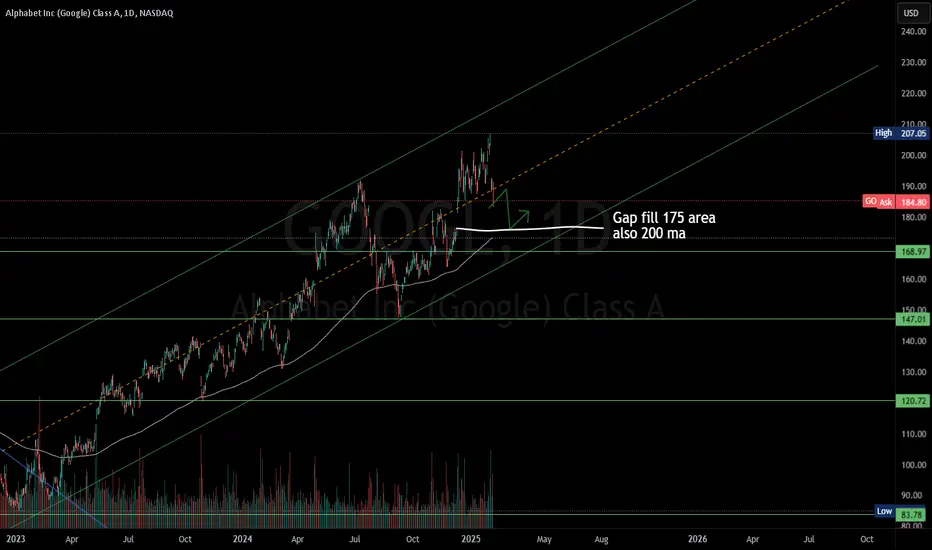
GOOGL correctionGoogle looks like it could retrace back to the 200 ma and the Gap fill at the $175 area before bouncing, depending on market strength i think we could see new highs over $220.
AI model seems to be stronger and more in demand than previous thoughts, with all the new engines, Gemini is taking market share.
I have always been partial to owning GOOGL for the fact of my YouTube consumption and I use GoogleTV, for my home.
I'm a long term buyer at $175 or lower.
No options on this for me, it moves different than some of the mag 7
Alphabet (Google) Stock Approaches Critical SupportIn recent sessions, Google's stock has recorded a decline of over 8% in just a couple of trading days, as market confidence weakens following the company's latest earnings report (February 4). Google Cloud services revenue grew by 30% , falling short of the expected 35% , signaling that competition in the cloud sector is becoming increasingly aggressive for Alphabet. This has dampened growth prospects for the company, leading to sustained selling pressure on the stock.
Uptrend at Risk
Google has maintained a solid uptrend since September 2024, with bullish momentum pushing the stock above the $200 per share level. However, the recent short-term bearish bias has cast doubts on the stock’s strength, as the price now approaches the trendline support level, where sellers must prove whether this movement is just a correction or a sign of a stronger bearish shift in the short term.
MACD Indicator
Currently, both the signal line and the MACD line have adopted a downward slope, while the histogram remains oscillating near the neutral 0 level. This indicates that the previous bullish dominance has faded, and if the histogram continues moving further away from the neutral zone, it could reinforce a stronger selling bias in the coming sessions.
Key Levels:
$200: The most important resistance level, aligning with previous highs in Google’s stock. A rebound to this level could revive the long-term uptrend.
$187: A critical new support zone, aligning with previous lows and the uptrend line support. Sustained movements below this level could reinforce the current bearish bias and threaten the long-term uptrend.
$173: A major support level, corresponding to previous neutral price zones. A breakdown to this level could signal the beginning of a much more extended downtrend.
By Julian Pineda, CFA - Market Analyst

Alphabet (GOOGL) LongAlphabet (GOOGL) Trade Idea: The stock has broken out from a large wedge pattern, signaling a strong trend continuation. Following earnings-related volatility, it is now stabilizing, setting up for potential upside. Given the technical strength and sustained momentum, this presents a compelling continuation play.

GOOGLE: Historic profits!! What is the reason for the fall?GOOGLE has been falling on the stock market since late yesterday, after presenting its results with the market already closed. Google's parent company achieved a historic profit of more than 100 billion dollars and revenues for the entire year of 350 billion. However, its shares are dyed red in the pre-opening.
--> What is the reason for the fall?
One possible cause would be that the fourth quarter revenues did not reach what was expected, which see in these numbers a sign that Google's parent company was being affected by the increase in competition in the digital advertising market and the slowdown of its cloud computing business.
A second reason is that Google surpassed historic highs days ago and it could be a MANIPULATION and PROFIT-TAKING movement by some FUNDS taking advantage of the volatility of the value to present results. In any case, the results ARE GOOD and the TECHNICAL ASPECT is good, so if nothing strange happens, the trend in Google will continue to be bullish.
--> What technical aspect does it have now after the -7% fall?
If we look at the graph, the technical aspect is still clearly bullish (Bull). In addition, it did not lose any of its main supports, so we will continue to think about long positions.
--> When could we enter?
The table shown in the graph indicates that the MOMENTUM in H1, H4 and DAILY time frames is bearish (Bear) and also the STRENGTH in H1 is bearish (Bear). Therefore, to ensure that the pullback has ended, we have to wait for at least in H4 the MOMENTUM to turn bullish (Bull) again. And when could this happen? When the price exceeds the 198 zone, it is very likely that the IVO indicator will already show us bullish MOMENTUM ( Bull ).
(If it happens before, I will update the analysis to anticipate the entry).
--> What important support does Google have?
The 184 zone is a very important support zone that, if not respected, we could see a much deeper retracement phase.
-------------------------------------
Strategy to follow:
ENTRY: We will open 2 long positions if the H4 candle closes above 198.
POSITION 1 ( TP1 ): We close the first position in the 208 zone ( +4.8%)
--> Stop Loss at 188.9 ( -4.8%).
--> Ratio 1:1
POSITION 2 ( TP2 ): We open a Trailing Stop type position.
--> Initial dynamic Stop Loss at (-4.8%) (coinciding with the 188.9 of position 1).
---We modify the dynamic Stop Loss to (-1%) when the price reaches TP1 (208).
-------------------------------------------
SET UP EXPLANATIONS
*** How do we know which 2 long positions to open? Let's take an example: If we want to invest 2,000 euros in the stock, what we do is divide that amount by 2, and instead of opening 1 position of 2,000, we will open 2 positions of 1,000 each.
*** What is a Trailing Stop? A Trailing Stop allows a trade to continue gaining value when the market price moves in a favorable direction, but automatically closes the trade if the market price suddenly moves in an unfavorable direction by a certain distance. That certain distance is the dynamic Stop Loss.
-->Example: If the dynamic Stop Loss is at -1%, it means that if the price drops by -1%, the position will be closed. If the price rises, the Stop Loss also rises to maintain that -1% in the rises, therefore, the risk is increasingly lower until the position becomes profitable. In this way, very solid and stable price trends can be taken advantage of, maximizing profits.

Google - some weakness expectedwww.cnbc.com
Don't take what the analysts take on the earnings too seriously. You would notice some companies have great earnings and yet the share price falls and vice versa. Anyway, I am queuing at the buy zone. See you there

Google Short on Regression BreakGoogle is the forth member of the Mag-7 to break downwards on their regression.
I am considering if there is a trend building that is tradeable....

Google Priced In GoldGoogle priced in gold's upwards momentum slowing to a grinding halt.
The capital rotation process gets much more evidence once this chart closes below that dashed line.
Not many understand this.


GOOGLE Impulse Spike for Friday, January 31 2025The Fibonacci levels on Google line up precisely at many junctures.. The FIB level just above the price channel and the closing price for Thursday, January 30, 2025 is near $203.85..
I'm of the opinion that price seeks that level today and then fades toward the gap (and a FIB level) at $182.25 -- A gap fill or gap JUMP to $174.75 is also possible.. This will depend on guidance after earnings.
One should consider the AI market is becoming saturated, and the vast money spent to promote Kamala will reflect in earnings *this* cycle, but not for the next cycle. I personally don't resonate with the myriad upgrades for price targets the expert pundits are making.
These are just my opinions and are not recommendations to buy or sell any stock or options.

Breaking: Alphabet ($GOOG) Shares Drop 7% in PremarketAlphabet Inc. (NASDAQ: NASDAQ:GOOG ) witnessed a significant 7% drop in premarket trading on Wednesday, driven by investor concerns over slowing cloud growth and the tech giant’s hefty $75 billion investment into artificial intelligence (AI) infrastructure. This figure far exceeded Wall Street’s projected $58 billion, raising doubts about the necessity and efficiency of such high spending.
AI Investment and Competitive Pressure
Alphabet has been aggressively investing in AI research and its integration across Google Search, Cloud services, and other platforms. However, the emergence of China’s low-cost DeepSeek AI model—which reportedly rivals leading U.S. AI models—has triggered discussions about whether Big Tech companies need to allocate billions toward AI advancements.
Cloud Growth Concerns
Alphabet's cloud division reported a 30% revenue increase to $11.96 billion in Q4, but this marked a slowdown compared to the 35% growth in Q3. In contrast, Microsoft Azure saw a 31% increase, while Amazon Web Services (AMZN) is projected to post only a 19% rise. Despite the slowdown, analysts believe the surging demand for AI-powered cloud computing will keep the long-term outlook positive for Alphabet’s cloud business.
Advertising Challenges
Beyond AI and cloud investments, Alphabet is grappling with fierce competition in the digital advertising space. With marketers increasingly shifting to social media-driven ad platforms like Meta’s Facebook and Instagram, and ByteDance’s TikTok, Google’s traditional ad model faces mounting pressure.
Technical Analysis
At the time of writing, NASDAQ:GOOG shares are down 6.75%, signaling a potential bearish continuation pattern. The stock appears poised to form a gap-down pattern, a bearish technical indicator that may lead to further downside pressure.
- Support Levels:* The first minor support lies at $197, aligning with the 78.6% Fibonacci retracement level. A breakdown below this level could result in gap-filling towards $185-$190.
- Major Structural Support: The BOS (Break of Structure) level is set at $155. A dip to this level could trigger further bearish sentiment and result in deeper losses.
- Moving Averages: Despite the premarket decline, NASDAQ:GOOG remains above key moving averages, suggesting that the broader trend remains bullish unless further downside momentum builds.
- RSI Positioning: Prior to this drop, the Relative Strength Index (RSI) was at 64, indicating that the stock was not overbought. This means the decline is not necessarily a reaction to overvaluation but rather a response to external market forces and investor sentiment.
Market Sentiment and Analyst Outlook
While some brokerage firms have cut their price targets on Alphabet, the median price target now stands at $220—still above its current premarket trading price of $191.20. Alphabet’s stock had gained 9% in 2024 before this drop, outperforming Amazon’s 10.3% gain and Microsoft’s -2.2% decline.
Conclusion
Despite the current dip, Alphabet’s long-term prospects in AI and cloud computing remain strong. The significant AI investment could prove to be a long-term advantage if it strengthens Alphabet’s competitive positioning. However, traders should closely monitor key support levels ($197 and $155) and whether the stock can hold above key moving averages.
For long-term investors, the recent drop could present a buying opportunity, but in the short term, further downside volatility is possible as market sentiment adjusts to Alphabet’s spending strategy. The coming days will be crucial in determining whether NASDAQ:GOOG can recover swiftly or continue its downward trajectory.

GOOGLE Buy the earnings dip and Target $215.Alphabet Inc. (GOOG) has been trading within a Channel Up since the September 09 2024 Low. Just last Friday it formed a Bullish Cross on its 1D MACD and is rising, which inside this Channel Up pattern, has been a strong buy signal.
Given that the company's Earnings miss will force the stock to open near or at the 1D MA50 (blue trend-line), take this excellent dip opportunity to buy the technical pattern and target $215, which is the standard +15% Higher Lows rebound the Channel had on each Bullish Leg.
-------------------------------------------------------------------------------
** Please LIKE 👍, FOLLOW ✅, SHARE 🙌 and COMMENT ✍ if you enjoy this idea! Also share your ideas and charts in the comments section below! This is best way to keep it relevant, support us, keep the content here free and allow the idea to reach as many people as possible. **
-------------------------------------------------------------------------------
💸💸💸💸💸💸
👇 👇 👇 👇 👇 👇

$GOOG breakout-pullback opportunityThis is a daily of GOOG, showing a swing high to the left, a breakout on high volume, and a pullback to the breakout level due to earnings reaction. If you have been waiting to get in on this monster, now is a high-probability time to do so.

$GOOGL Stocks Sink on Alphabet Earnings; Gold Hits AllTime High Stocks Sink on Alphabet Earnings; Gold Hits All-Time High 📉✨
1/9
Global stocks dipped after Alphabet ( NASDAQ:GOOGL ) missed earnings expectations, putting pressure on Wall Street futures. Investors are now questioning tech's growth outlook. 📉 Could this signal a broader tech revaluation?
2/9
Alphabet’s earnings disappointment impacted sentiment across markets, while some European stocks showed resilience. Novo Nordisk delivered positive earnings, highlighting sector-specific strength. 🏢📊
3/9
Currency Moves: The USD/JPY pair saw notable movement as the yen strengthened. Japan’s wage data came in higher than expected, fueling speculation of another rate hike. 💴 Could this be a turning point for the yen's momentum?
4/9
The dollar weakened against major currencies, driven by Japan’s wage growth data and broader market uncertainty. Currency traders, take note: further BOJ tightening may continue shifting capital flows. 📉
5/9
Gold Surge: The precious metal hit a record high today. A weaker dollar and heightened geopolitical risks are driving investors toward safe-haven assets like gold. 🚀 Will this trend hold if market volatility persists?
6/9
Political surprise: President Trump made unexpected remarks about potential U.S. involvement in Gaza for economic development. Despite the shock value, markets largely shrugged off the news. 🗞️ Investors kept their eyes on the numbers instead.
7/9
Market Insights:
Alphabet ( NASDAQ:GOOGL ): Missed earnings shook tech stocks.
USD/JPY: Yen gains signal a potential shift in forex markets.
Gold: Safe-haven demand pushes prices to new highs.
8/9
Investors may need to reassess their tech positions in light of Alphabet’s performance. Meanwhile, forex traders could find opportunities in USD/JPY movements, and gold investors are riding a bullish wave. 🧭
9/9
What's your market outlook after today's moves? Vote now! 🗳️
Tech will rebound soon 📈
Volatility will dominate 🔄
Gold remains king of 2025 ✨

Alphabet - 5 waves up completed and correction incoming ?The reaction of price to the lastest earnings wasn't positive and it went down a few fib levels.
It was right at the top of the channel and 5 waves since 2022 could be completed.
Alternatively this drop can be wave IV of 5 and we will see one more higher high in the 220$ area.

2/4/25 - $googl - Why not. Buy into EPS2/4/25 :: VROCKSTAR :: NASDAQ:GOOGL
Why not. Buy into EPS
- i've always liked NASDAQ:META more
- but seeing they're exposed to the same trends, the deepseek BS should be (and mkt has agreed, at least temporarily), a net +ve to software-first businesses esp w their own language models and esp native inference chips (TPUs at google don't seem to be in the multiple).
- low 20x PE, 3.5% fcf yield, growing DD and a consumer that has proven to be resilient in 4Q vis a vis subscription names like NYSE:SPOT , or consumption names like $meta...
- worth a roll esp bc chart has good upside to let run into price discovery
- keeping it small, but setup seems to favor a small punt long
whatcha think anon?
V
