$IBKR with a Bullish outlook following its earnings #Stocks The PEAD projected a Bullish outlook for $IBKR after a Positive Under reaction following its earnings release placing the stock in drift A with an expected accuracy of 80%.
IBKR trade ideas


$IBKR 1 Year Cup with Handle$IBKR a 37% deep year cup with handle setups with 200 MA just turning back up.
OBV making new highs before price.
Looks good.

$IBKR with a Bullish outlook following its earnings #Stocks The PEAD projected a Bullish outlook for $IBKR after a Positive Under reaction following its earnings release placing the stock in drift A with an expected accuracy of 75%.
IBKR LongI am bullish on IBKR for next week. I estimate it can recover Friday loss this week. below $72.5 trigger me.

$IBKR with a Bullish outlook following its earnings #Stocks The PEAD projected a Bullish outlook for $IBKR after a Negative over reaction following its earnings release placing the stock in drift C with an expected accuracy of 72.73%.

IBKR Interactive brokers barometer for the stock itself .... IBKR Interactive brokers barometer for the stock itself ....

IBKR share reversal pattren spotted.Hello dear fellow traders !
Today i spotted a reversal bearish engulfing pattren in interactive broker stock, as we can see in chart that after a minor uptrend prices has reversed and form a candle which looks like sellers are totally in control and share can continue towards down trend and we can get 3% to 4% in profit's.
Thank you.....

IBKR Weekly Technical AnalysisIBKR - Weekly - EDUCATIONAL only - Support, Resistance, Pitchfork, Parallel Chanel - Hope it Helps, Good Luck


Current setup on IBKR | Full explanation Let's take a look at IBKR and the current setup I'm waiting for.
As you can see on the chart, I have defined all those situations with one thing in common, massive drawdown in terms of time and decline and the subsequent resolution after we have a new all-time-high (ATH).
First Scenario: 65% decline and 2660 days until a new ATH / Followed by a 27% bullish movement from the previous high.
Second Scenario: 35% decline and 826 days until a new ATH / Followed by a 75% bullish movement from the previous high.
Third Scenario (current situation): 57% decline and 1316 until a new ATH / Followed by ????
The idea I have right now is that I'm expecting a similar resolution of the previous 2 scenarios based on past behavior. Am I saying this will happen? Of course not; my win rate is 50%; however, the risk to reward ratio I'm looking at on this setup is 2.5. In other words: for every dollar I'm risking, I'm aiming to make 2.5 dollars.
Alright, let's speak about the trading template: The pattern I observed in all the previous bull runs goes like this:
a) The price makes a new ATH
b) The price makes a 7 days consolidation
c) Entry above the consolidation, stop below, target at 255% movement from the previous high (i want to be conservative)
d) IF everything goes as expected, the expected time for this resolution is between 50 to 100 days.
To be clear, these are the levels I'm using:
ENTRY: 81.30
STOP: 73.85
TAKE PROFIT: 99.99
BREAK-EVEN: 89.00 (I will move my stop loss to the entry-level)
Thanks for reading! Feel free to add your charts or view in the comments.


Silver Dynamics IBKR10.12.21 Silver Dynamics IBKR ..................................................................

IBKR leading indicator?The chart of Interactive Brokers NASDAQ:IBKR compared with S&P futures.
We can see that the 2 prices move in tandem for the most part except for a period between mid till late 2018 where a significant drawdown of the SPY was preceded by a V top (inverted V) pattern where IBKR's price moves up in a straight-line run then drops almost as quickly as it ascended.
If this same pattern were to repeat in 2021, we could expect a looming market correction.

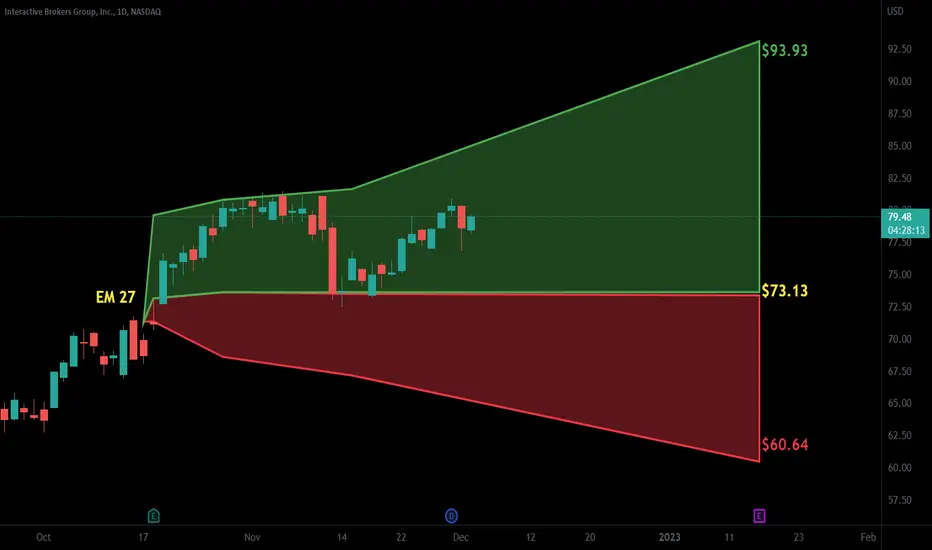
Compression on IBKR. What to expect in both directionsToday, we will take a look at Interactive Brokers Group.
a) The main thing we can see on the chart is that the price is getting compressed between an ascending and a descending trendline.
b) Let's take a look at the Weekly Context
c) When a situation like this is happening, it is not a good idea to develop setups if we are inside this compression, at least for traders that look for trends to profit.
d) So, the main idea here is to wait for either a bearish or a bullish breakout before taking action.
e) For both scenarios, the idea is waiting for an ABC pattern or similar structure
f) If that happens, we will confirm both views with the price reaching the green or red horizontal line. above/below "B"
g) Targets are defined on the chart.
The main conclusion here is: Avoid compressions. Wait for the breakout first and for the consecutive correction before developing setups. Thanks for reading!

big cup and handleso I like IBKR's because of the recent earnings report and because it is a software as a service.
I also like how they handled the GME situation. Instead of accepting orders and not actually giving people their shares but taking their money they just never took their money.
better multiples than Charles Schwab and Fidelity
the cup and handle price target is about $128


