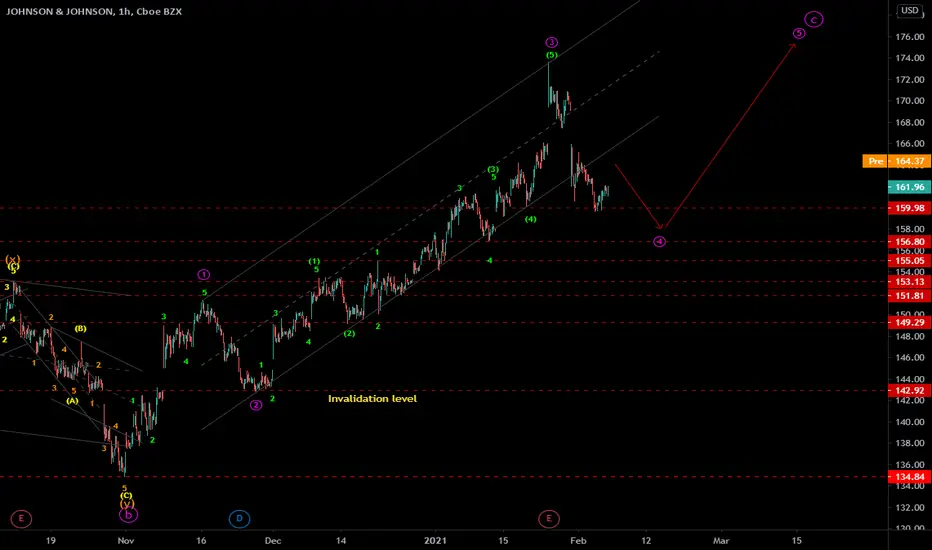
Medium Term Bullish on Johnson & Johnson
The Retracement back to 159.64 looks like a 4th wave decline from the 173.47 levels which measures a retracement between 38.2 - 50% of wave - 3
Wouldn't wanna see any price action close below the bottom of recent gap.
JNJ trade ideas

Traditional|JNJ|Long and short *H.rLong and short JNJ *High risk
Activation of the transaction only when the blue zone is fixed/broken.
Working out the support and resistance levels of the consolidation zone.
* Possible closing of a trade before reaching the take/stop zone. The author can close the deal for subjective reasons, this does not completely cancel the idea and is not a call to the same action, you can continue working out the idea according to your data, but without the support of the author.
The "forecast" tool is used for more noticeable display of % (for the place of the usual % scale) of the price change, I do not put the date and time of the transaction, only %.
The breakdown of the upper blue zone - long.
Breakdown of the lower blue zone - short.
Working out the stop when the price returns to the level after activation + fixing in the red zone.
Blue zones - activation zones.
Green zone - take zone.
Red zone - stop zone.
Orange arrows indicate the direction of the take.
Red arrows indicate the direction of the stop.
Priority - The value of the priority parameter implies the author's subjective opinion about the more likely activation zone on this idea, this does not mean that this idea will be 80% activated by this parameter, the purpose of the parameter is to provide for the risk of the inverse of the zone parameter.
Example: "Priority Long: So the author inclines more in the direction of the activation zone open long trades, in this case, when reaching the activation zone in short you should be very careful, because this area may be highly likely to be punched about the breakdown/do not get to take/activate transaction from go to stop."
Please consider this parameter if you use my ideas.
SUM PNL: This parameter displays the total % of all closed ideas of the "new" format (according to the author) for this sector at the time of publication of the idea. The calculation is very "clumsy" just the sum of the profits of all the ideas, based on this indicator, you can more accurately assess the risks when working with my ideas of this sector. I present you the construction of the idea, you can use it yourself as you like based on your subjective view and risks, the calculation of the PNL indicator is carried out only on transactions that the author closed on TV in manual mode or by take.
P.S Please use RM (risk management) and MM (money management) if you decide to use my ideas, there will always be unprofitable ideas, this will definitely happen, the goal of the system is that there will be more profitable ideas at a distance.

JNJ - EW analysis - C wave upJNJ - It is in 4th wave correction and expected to spend some time before start moving in 5th wave up.
Give thumbs up if you really like the trade idea/analysis.
Easy money by selling at this time for the next week easy money, the chart shows us that there is a movement of selling now and the price is going down next week

Johnson & Johnson, a sell or a buy?Technically it's a sell, but fundamentally it's a buy (vaccine approval). I can't decide.

Mid Term J&J sketch. Johnson & Johnson. Post close of NYSE -1/26/2021.
My sketch of J&J indicates:
that we have broken above LT trend line and have gained momentum ahead of ST Trend line.
we have a perfect FB setup with a Retrace to? 0.5 is my guess.
interested to see if Momentum indicates a strong trend redirect and the beginning of a fourth EW.
Note: I did not use support / Resistance in this chart but may take a look tomorrow at shorter time frame to see where the daily traders are pressuring.
Cheers !

Johnson & Johnson... boring, but its call options are not.I am long April 170c and March 160c
Pretty clear to me JNJ is about to get on a big run. Look at it against the S&P and the Dow:
JNJ vs S&P 500
JNJ vs Dow Jones:
And zoomed in JNJ vs Dow Jones:
Johnson&Johnson breakoutThe johnson and johnson breakout will not be stable and possiblities are high it will pull back into the trend channel. RSI is overbought and usually JNJ is uptrending slower in the past.
Good news are possible fighting corona, but market should have took this into attention.
Hold if you have the stock or buy it when it comes down a little.


Buy JNJ 5/1/2021Johnson & Johnson stock is moving in a short-term up trend
Prices are testing EMA 13
So you can buy target 166 stop losses 148


Johnson & Johnson earnings tomorrow at 6:40amJohnson & Johnson earnings are tomorrow at 6:40am. My range is low $157, mid $162, high $167.
4th Quarter December 2020
Consensus =
EPS: $1.81
Revenue: $21.73 Billion
Do your own due diligence, your risk is 100% your responsibility. You win some or you learn some. Consider being charitable with some of your profit to help humankind. Small incremental steps work : If you double a penny a day for a month it = $5,368,709. Good luck and happy trading friends...
*3x lucky 7s of trading*
7pt Trading compass:
Price action, entry/exit
Volume average/direction
Trend, patterns, momentum
Newsworthy current events
Revenue
Earnings
Balance sheet
7 Common mistakes:
+5% portfolio trades, risk management
Beware of analysts motives
Emotions & Opinions
FOMO : bad timing
Lack of planning & discipline
Forgetting restraint
Obdurate repetitive errors, no adaptation
7 Important tools:
Trading View app!, Brokerage UI
Accurate indicators & settings
Wide screen monitor/s
Trading log (pencil & graph paper)
Big organized desk
Reading books, playing chess
Sorted watch-list
Checkout my indicators:
Fibonacci VIP - volume
Fibonacci MA7 - price
pi RSI - trend momentum
TTC - trend channel
www.tradingview.com

JNJ - EW analysis - C wave up JNJ - It seems like the 3rd wave is either finished or may end soon, thereafter 4th wave correction will start and may finish within the zone of 160-157, which will be good buy zone for next cycle up as 5th wave.
Give thumbs up if you really like the trade idea.


Ascending triangle breakout, record annual income projectedTextbook ascending triangle breakout. I took a look at net income as a sanity check, projected to be record setting. Swing trade, could drop back down to triangle top for retest, set stop below that. Price target is the height of the triangle above the triangle, hence a copy of the triangle being used as a reference. Set target below that to avoid psychological whole number resistance.


JNJ BullishJNJ is a federally subsidized company and is currently making new highs. It is in the S&P500, and has been a consistently bullish stock throughout times. Right now it is in the middle of an upwards move. JNJ is one of the companies that has been producing the COVID19 vaccine.
I hope you have a wonderful holiday I will see you all Tuesday

Easy bullish trend for Johnson & Johnson (JNJ)Fundamental Analysis.
1. Industry: Corona Vaccin ++
2. Price: Relatively Cheap
3. Upward potential: 20-40%
4. Risk-Reward Ratio: 1:10
Technical Analysis.
1. Volume is growing
2. Support of the MA30
4. Financial Morningstar Score: A
4. Growth rate: 93%
5. Short-term target: 180
6. Long term target: 200-
7. High Dividend Rate

Johnson & Johnson (JNJ)JNJ is well positioned for an interesting 2021 as COVID vaccine is a driver of growth and rebound in its Medical Devices Division should propel the stock price to new highs. Unlike the vaccines from Pfizer (PFE) and Moderna (MRNA), Johnson & Jonson's vaccine only calls for one dose in the treatment regimen. This stock offers worthwhile risk-adjusted, total return potential with a dividend yeld of 2.80%

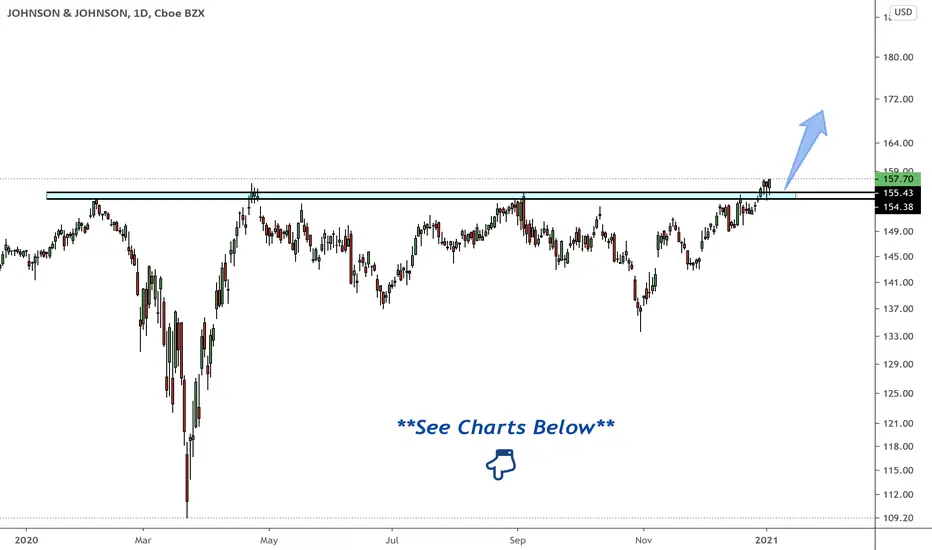
JOHNSON & JOHNSON D1Johnson & Johnson Company is one of the largest hygiene products companies. The company's shares have recently reached historic highs. The global pandemic influenced this significantly. Because the company's products at that time were in great demand and the company received quite large profits, which became an incentive for the growth of the company's shares. But most likely this is not the limit and in the near future we will be able to see the next maximum. The situation with the corona virus does not end, but rather picks up a new wave. What the statistics say. And although vaccination has already begun in many countries, it is unlikely that this will quickly solve this problem. Thus, the company's products will be actively sold and continue to further stimulate shares to grow.


JNJ - EW analysis - 3rd of C wave upJNJ - It is in 3rd wave up of C wave cycle. The internal 3rd wave is about to end and 4th wave corrction will starts, buy the correction for next higher high as 5th of 3rd of C wave up.
Give thumbs up if you really like the trade idea.

