Call Ratio Spread CreditA ratio call spread is a neutral strategy in which we buy several calls at a lower strike and sells more calls at a higher strike. In a ratio call spread with credit, there is no downside risk. The ratio spread that we see on the chart has a ratio of 2:1.
We can see from the chart the non-linear behavior of options.
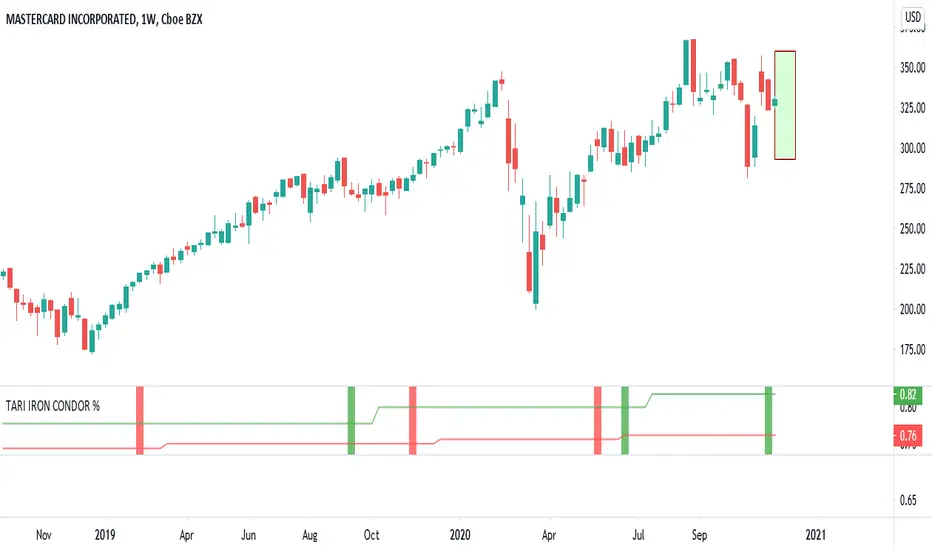
Inputs: MA (Mastercard)
Credit received -> 3.1 ($310 for one position)
Stock price -> 332
Upper strike -> 340 , 2 calls sold
Lower strike -> 330 , 1 call bought
Days to expire -> 37
Implied Volatility -> 0.291 (29.1%)
Date -> 11/11/2020
The credit received is $310, the maximum profit is $1310 with less than 1% probability, the maximum loss is theoretically unlimited.
In this example, one call was bought at 330 strike price for 14.2 and two calls were sold at 340 strike price for 8.65 each, in total 17.3.
The credit = 17.3-14.2 = 3.1
If at expiration the stock price will be below the lower strike (330), all of the options will be worthless and all the credit will be received.
The maximum profit at expiration for a ratio spread occurs if the stock is exactly at the striking price of the sold options. The reason is that the call that was bought has some profit (stock price above strike price) and the sold options are worthless.
Maximum profit = The spread (340-330=10) + Credit received (17.3) – Debit paid (14.2) = 13.1 => $1310 (mulitpling by 100 shers per option contract)
The risk in this position is to the upside. The calculation for the break-even at expiration.
Break-even point = Upper strike price + the points of max profit = 340+13.1=353.1
This strategy has a high probability in general and even more so when used correctly.
The example that has been used could profit the most in the blue zone, where the profit is greater than 50% of the maximum profit, but it will take 34 days out of 37 to reach there.
How implied volatility affect this position?
In a ratio spread, there are more options sold than bought, in the previous posts we saw that volatility increase is harming sold options and benefits bought options, this example is no different.
10% increase in implied volatility, the lines are now in a worse location compare to the original position.
10% decrease in implied volatility, the lines are now in a better location compare to the original position. The position can now reach the 50% max profit zone in 30 days.
The next post will be on ratio spread debit, that looks different from the ratio spread credit, the solution to the partial differential equations of the Black-Scholes model can be seen.
MA trade ideas

IRON TARIHi guys!
New Iron condor, chek my last trades, and get my script for free!
Enjoy your wallet!
Tari.

MA - Elliottwave analysis - ABC zigzag up - B down in progress MA - It is in B wave as double correction, where one more down cycle expected to finish the correction as C of Y wave down to finish (B) wave near 321. Buy in that zone for (C) wave up for target above 360 or higher as ABC zigzag up cycle.
Give thumbs up if you really like the trade idea.

Inverse HnS on Mastercard Daily - I'm already InHere we have a nice setup on Mastercard - Inverse head and shoulders. My buy levels, stop levels, and take profit levels are on the chart. Enjoy!
Please feel free to check out my other ideas, I really want to help people understand the market the way that I do.
I hope we profit TOGETHER! If you found this to be insightful or helpful, please show appreciation by hitting that like button. If you want more ideas I invite you to follow as well! I try to be here for all of my followers with any questions they might have. Feel free to shoot me a DM or comment below to start a conversation! DM me to get these charts and my ideas before anyone else!

Clear bullish Strenght on the Market / MASTERCARDLet's see why we expect more bullish pressure coming on the market based on technical items.
a) The price made a new ATH in September 2020, and after that, we observed a Massive Corrective structure. (This type of structures can tell us about the Accumulation process going on)
b) In November, we observed a breakout of the Massive corrective structure
c) Now, after a month of the breakout, we can see a minor corrective structure on the edge of the previous one
d) Based on the current levels and structures, we expect a continuation of the bullish movement IF the price breaks above 354 (Above the previous All-time high)
e) Our Targets are 375.98 as the first level and 402.18 as the second level.
f) IF the price goes in the expected direction, we will wait for a 50 days resolution.

Buy - $MA - MastercardBuy signal generated from automated system.
Entry at market price
SL - $280
TP - To be confirmed


MA - Elliottwave analysis - ABC zigzag up - B down in progressMA - It is within correction of B wave as wxy double three. It is going down up to 315 or lower level to complete the B wave, where it reverses for C wave up thereafter. Buy only after confirmation of impulse up cycle for target above 370 or more.
Give thumbs up if you really like the trade idea.

HEAD AND SHOULDERS INSIDE THE HEAD AND SHOULDERS. TO 420$ SOONMONTHLY TF - BULLISH
WEEKLY TF - BULLISH
DAILY TF BULLISH
HAPPY TRADING


Mastercard key levelsIf the mood doesn't change, Mastercard can go to a new high.(400USD)
It seems strong because, it was pulled back quickly from 280USD.
Resistance levels: 320 and 300 USD
Be patient and be careful, always:)


MA LongLooks like "Bull flag"
Entry 326
Stop 316
target1: 355;
target2: 400;
I am not a PRO trader. I need few months to practice trading strategies.
If you like this idea, please use SIM/Demo account to try it, until my trading plans get high winning rate.


MA - Elliottwave analysis - dump and pump set upMA - It is in B wave correction as abc zigzag down, so can be a small sell set up near 340-345 with stops above 356.50 for target zone of 320, where B wave will finish and expected to new rally for C wave up in ABC zigzag move up from major bottom of 280, which can go above 370 or even higher.
Give thumbs up if you really like the trade idea.

Bullish Crab x 5Possible stop below 281.15
Long entry level 309.15
Possible T2 390.2 to 420.5 (longer term)
MA fell from a bearish rising wedge several weeks ago at 327ish
Deep pull back ensued and seems to have recovered
Gaps below price can provide support
Pattern only valid at or above LE level
Just an observation
The Crab pattern is similar to a Butterfly pattern in that it is a reversal pattern composed of four legs marked X-A, A-B, B-C and C-D.
Like the Butterfly, it can help you identify when a current price move is likely approaching its end. This means you can enter the market just as the price reverses direction.
As with many patterns, there is a bullish and a bearish version of the Crab
Identify where the pattern will complete at point D – this will be at the 161.8% extension of the X-A leg. Place a buy order here.
If you want an aggressive profit target, however, you can place it at point A of the pattern. For a more conservative profit target, place it at point B.
Like many harmonic patterns, fibonacci retracemnts are used

