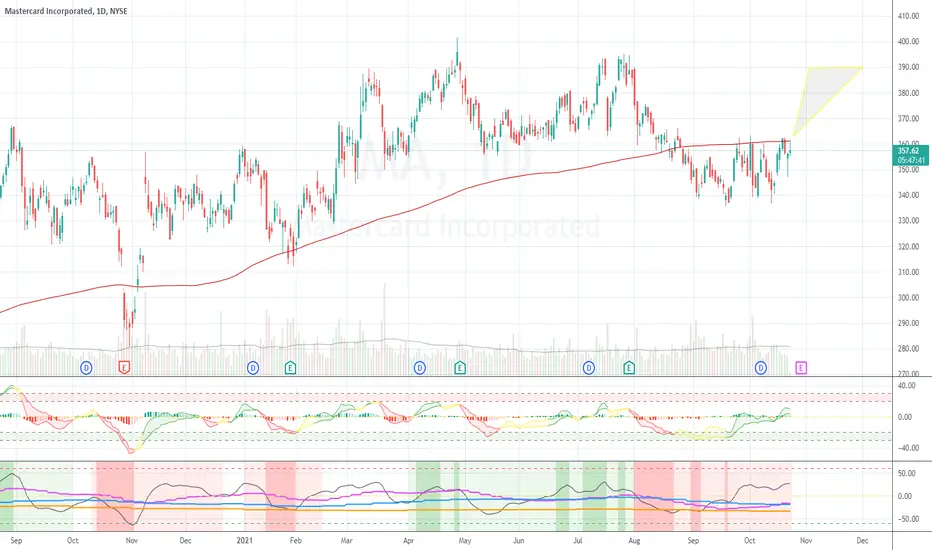
MA LongSideway Consolidation, near bottom support line
Entry 327
Stop 320
Target 366, 393
10/28 good earning
Next better demand zone entry at 295.
Risk management is much more important than a good entry point.
I am not a PRO trader.
In my trading plan, the Max Risk of each short term trade should be less than 1% of an account.
MA trade ideas

$MA trade ideaLooking for $MA to potentially fill the gap from 351 - 356$ this week.
Potential trade:
$MA 11/12 355$ call
$MA 11/19 360& call

Technical analysis (MA)Mastercard, Inc. (MA)
Target - 347,55
Risk/Reward Ratio - 3,54
Stop-loss - 320,80
On this signal, buy 50% of the position

MA - Earnings "Guess"MA has a nice bullish chart. Assuming earnings aren't disastrous, it looks like it should continue to strengthen back to recent highs.
I'm not buying it right now, since i have enough long positions currently, but would if i didn't.
MA analysis According to the chart, the price has been broken out from our dynamic resistance which illustrates the falling wedge caused the bullish setup on daily time frame.
Moreover, RSI has been sharply increasing these days also it could be more bullish
However, the fundamental should be reviewed first to have a better trading
In addition, the pattern has been already triggered, so it is better to pay attention on the entry price which affects on the final interest.
To sum up, There is no financial advice here please do your own research to have a better position.

MA daily chart , top of range, breakout to watch outwww.tradingview.com
On daily chart Mastercard is in range since nearly 2 months.
Volume may be interesting to expect a breakout anytime soon.
200 MA just above the resistance area may be dangerous.
If the price break the 200 MA and the range, it's gonna be a great entry signal.
✅ Watchlist


MA - STOCKS - 11. OCT. 2021Welcome to our Weekly V2-Trade Setup ( MA ) !
-
4 HOUR
Bullish market closure!
DAILY
Expecting more upside after a small pullback.
WEEKLY
Great long entries, following midterm trend.
-
STOCK SETUP
BUY MA
ENTRY LEVEL @ 352.97
SL @ 338.87
TP @ Open
Max Risk: 0.5% - 1%!
(Remember to add a few pips to all levels - different Brokers!)
Leave us a comment or like to keep our content for free and alive.
Have a great week everyone!
ALAN


$MA down 20% from ATHMA is another strong company with a great business. It has pulled back below the 200 EMA. Solid long term company to add on this market weakness. Consumer and business spending strength are not one of the issues facing our economy going forward (for now at least) which would make both MA and V good opportunities here.


Short Sell Signal on MasterCard MAMastercard has been consolidating in a range for a while. It tries to go up but even at a small rise, there has been selling pressure building. Short Sell MA with SL 370 for targets much much lower levels.
Disclaimer :
Trading is never ever recommended as it is injurious to mankind. This is purely my study based on technical charts and for educational purpose only. Please do your analysis before taking any trades given by me. I MUST not be held responsible for any profit or loss out of any trades you take on our advice. All Disclaimers Apply.

MA looks good for a twenty dollar moveMA is at the bottom of a double top trend and now it looks for a nice move
- The gravestone Doji at the bottom of the trend signifies a reversal
+ Where the Doji was the RSI was at its lowest which is another indicator of a reversal
- The fast moving MACD (5,35,5) line just crossed the signal line
- MA typically uses the midline of the pitchfork as a level of resistance
+ The midline + fibonacci extension estimate the resistance point would be around 378
+ The pitchfork estimates that MA would reach this point around September 22
5 hours ago
Comment: If MA falls then this is its support level
- If MA continues to trend up: entry $353
- If MA drops: entry $348.31, $346.69
- Stop Loss: $344


MA looks forward to a twenty dollar moveMA is at the bottom of a double top trend and now it looks for a nice move
- The gravestone Doji at the bottom of the trend signifies a reversal
+ Where the Doji was the RSI was at its lowest which is another indicator of a reversal
- The fast moving MACD (5,35,5) line just crossed the signal line
- MA typically uses the midline of the pitchfork as a level of resistance
+ The midline + fibonacci extension estimate the resistance point would be around 378
+ The pitchfork estimates that MA would reach this point around September 22

MA very cheapAfter a nice peak on July this is now at discounted prices.
MA it is expected to increase earnings in the future.
Careful as its MA200 is still down, though.

$MA LONG #mastercard Check out the green lines on chart at rsi reversal and chart the same reversal
reversal confirmed now
disclaimer

channel break in daily chart here you can see the perfect level on chart targets stop loss
easily you can on a daily basis chart channel break heavy volume and previous 200dma

RectanglePrice below bottom trendline of the rectangle.
I did not think it would go there.
No recommendation and perhaps will pull back inside soon.
Down targets are mere calculations and things change and it could have hit support today. The only thing that never changes, is change (o:

MA Elliott wave countAfter making 5 wave price had correction look like abc flat, near resistance is 330 if it hold 330 may be price will bounce, otherwise it will continue bearish momentum

$MA Reversal candle yesterday #MasterCardwe had a reversal candle yesterday and today we will have green day and here!
disclaimer

MA Bouncing of the Anchored Monthly VWAP and calls flow bullish MA Bouncing of the Anchored Monthly VWAP and calls flow bullish. Very oversold
