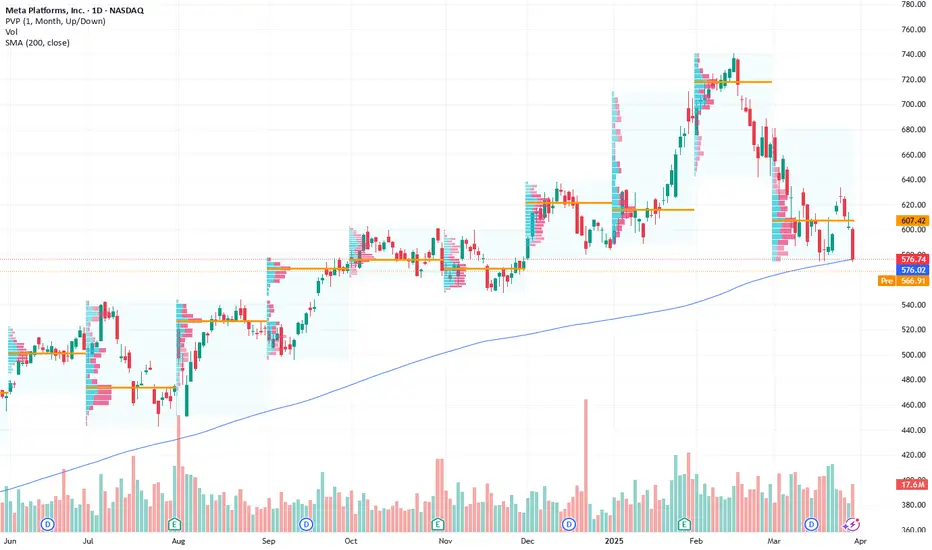
Meta - The Correction Is Officially Over!Meta ( NASDAQ:META ) is retesting the previous all time high:
Click chart above to see the detailed analysis👆🏻
For more than 7 years, Meta has been perfectly trading in a reverse triangle formation. And just three months ago, Meta once again retested the upper resistance trendline and reversed towards the downside. But with the retest of the previous all time high, this correction is over.
Levels to watch: $500, $800
Keep your long term vision,
Philip (BasicTrading)
META trade ideas

META watch out if market is not completing a V-form
Mark does not look happy....
See that META is now below the MA, since it had the previous behavior of falling like a stone massive amount of percentage, it is more likely to do it again.
Look on this one carefully if you are long.
If the market will not complete the V-Formation, and shoot up, we may see the stock fall again, substantially.

The Truth About 2nd Retests in Forex, Stocks, and Crypto"Structure protects the trader from their own emotions."
This post is for those traders out there who have been second-guessing themselves when the market pulls back. If you're noticing second retests more frequently in Forex compared to stocks and crypto, you're not imagining things. Let me break it down from experience and research.
🔄 2nd Retests: What Are They?
The "2nd retest" refers to when price:
Breaks through a key level
Pulls back to that level
Then comes back again to retest that zone before the real trend unfolds
💱 Forex: Where Retests Move Fast
Forex has high liquidity and volume. When a level is broken, you often get a quick pullback, then a second retest -- sometimes in the same session. It's common to catch a good entry, see profit, then watch price reverse, hit the zone again, and consolidate with a W or M formation.
This is where most traders start to doubt themselves.
But if you're reading structure and candles properly, you're not wrong -- you're just early.
Remember: Forex is designed to shake you out with speed.
📊 Stocks: Slower and Sentiment-Driven
Stocks don’t move like Forex. They’re based more on fundamentals, earnings, and market sentiment.
2nd retests happen, but they play out over days or weeks
You often see consolidation ranges instead of clean pullback entries
That means unless you’re patient or watching higher time frames, you’ll miss it or get caught in sideways chop.
💿 Crypto: The Middle Ground
Crypto behaves like Forex, but slower. Patterns like W and M retests still appear – but it takes more time. The liquidity isn’t as deep, and reactions are more volatile.
You need strong discipline
You need to trust your zones
Don’t expect instant gratification
🧠 My Strategy: Multi-Timeframe Surfing
I personally surf between multiple timeframes to track how the candle looks and behaves:
Lower timeframes = Reaction + Entry Zones
Higher timeframes = Intent + Trend Bias
When I catch the first breakout and get into profit, I don’t panic if the 2nd retest comes.
I look for structure -- not emotion.
If you're unaware of the candle you're trading on, you'll always feel lost in the retracement.
So instead of jumping ship, I wait. I watch the new candle form. I know where I'm at in the story. That's what keeps me in the trade and out of my feelings.
🔹 Final Takeaway:
Whether you're trading Forex, Crypto, or Stocks — the market always leaves clues.
But you need:
A solid grasp of structure
Understanding of candle behavior
Patience to let the 2nd retest show its true intent
Stay sharp. Stay grounded. Trust the chart — not the chatter.
Let me know your thoughts below. How often do YOU see these 2nd retests in your trading?

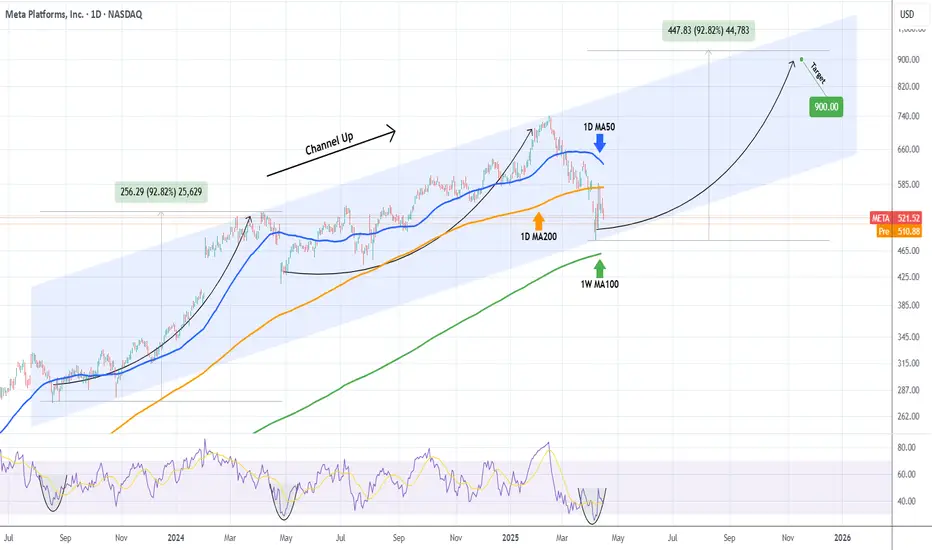
META Slow recovery but $900 possible this yearMeta Platforms (META) had a strong -35% correction in the past two months, dipping even below its 1D MA200 (orange trend-line). By doing so, it reached the bottom (Higher Lows trend-line) of the 2-year Channel Up and rebounded instantly.
The rebound has stopped so far on the 1D MA200 where it got rejected. This keeps the market neutral and the long-term bullish sentiment can only be resumed if the market breaks and closes above its 1D MA50 (blue trend-line). Until then we are neutral but only as long as the 1W MA100 (green trend-line) holds, below it the bearish trend is resumed and the correction can potentially reach -50% to -70%.
If however we close above the 1D MA50, expect a +90% rally, similar to the first Bullish Leg of the Channel Up, slow at start but aggressive after half point. Target $900.
-------------------------------------------------------------------------------
** Please LIKE 👍, FOLLOW ✅, SHARE 🙌 and COMMENT ✍ if you enjoy this idea! Also share your ideas and charts in the comments section below! This is best way to keep it relevant, support us, keep the content here free and allow the idea to reach as many people as possible. **
-------------------------------------------------------------------------------
💸💸💸💸💸💸
👇 👇 👇 👇 👇 👇
META in a Tug-of-War: Gamma Pin Threatens Breakout Setup📊 Technical Analysis (1H Timeframe)
META has recently completed a strong bounce from below the lower trendline of the ascending intraday channel. However, the follow-through was weak, and price is currently consolidating tightly just beneath the midpoint of the Gaussian channel.
* Channel Structure: META is still respecting the ascending parallel channel, but recent candles show hesitation near the midline. There's visible loss of momentum since touching $588.
* Key Levels:
* Resistance: $555 (psychological + rejection zone) and $588.28 (upper channel).
* Support: $535.38 (retest level) and $494.23 (channel base).
* Volume: Rising volume on the initial breakout, but fading in the sideways zone—sign of indecision or smart money waiting.
* RSI: Currently flatlining under 50, indicating neutral momentum with slight bearish bias.
💡 What to Watch:
META is building pressure near a pivotal level. If it breaks $555 with volume, it opens room toward $570–$588. But if it loses $535 support, sellers might regain control, pushing toward $520–$500 zone.
🧠 Options GEX Sentiment + IV Outlook
META is pinned hard by options market makers, and the GEX setup shows tension in both directions:
* Highest Negative GEX / PUT Support: $543
* 2nd Put Wall (High Gamma Impact): $535
* Call Resistance: $600, with strong clusters at $570 and $555
* GEX Read: Very negative near $543–$535, implying dealer buying pressure (support zone) if price dips.
📉 IV & GEX Stats:
* IVR: 76.6
* IVX Avg: 66
* IV Slope: -6.34% (slowing implied volatility)
* Options Sentiment: 23% PUTs — moderately bearish bias, but not overly fearful.
📈 Suggested Option Strategy
Neutral to Slightly Bullish Setup
Gamma pin near $543 suggests limited downside risk unless $535 fails.
Trade Idea:
* Debit Call Spread: Buy $550C / Sell $570C for next week
* Defined risk and reward while playing the bounce to resistance.
* Alternative: If $535 breaks — shift to bearish spreads or short-term puts toward $515 target.
🧩 Final Thoughts
META is coiled between strong dealer support and overhead option walls. Gamma compression might suppress large moves until $543 breaks cleanly in either direction. Smart trade is to wait for a breakout or rejection confirmation before sizing in heavily.
This analysis is for educational purposes only. Trade your own plan, manage risk, and stay nimble.

META : A+ Setup Analysis and Entry TargetsIn this video, I share my analysis on Meta. You get the full overview of how I find my trade setup and entry points.

Spike RetracedYesterday's spike and the 3 days long lasting rise have been retraced today.
The expectations have risen the past 4 days and we may expect a new test of the March high now at least.

META watch $486/89: Major Support for at least a DeadCat bounce META dropping even though it is mostly immune to tariffs.
Now approaching a major support zone just below $490.
This should give at least a "dead cat" bounce to $508 fib.
$485.95 - 489.05 is the exact support zone of interest.
=================================================
.

Meta: Extraordinary Gains Unravel as Tariffs Amplify Sell-OffMeta posted an unprecedented 741% rally from $88 to $740 within two years, culminating in early 2025. The exhaustion pattern at 740—coupled with the breakdown of the 694 and 630 support levels—signalled the end of the bull run. The last stand at 564 failed in March, unleashing a steep 15% drop over three trading sessions.
Currently sitting near $504, Meta is testing the crucial 500 psychological barrier. A clean break could open the way to 460, 434, 410, and even 394. Any bounce will face resistance at 524 and 564—key levels where bulls previously failed to hold momentum.
Fundamentally, Meta faces significant advertising revenue pressures due to economic uncertainty and declining consumer engagement triggered by tariff-induced stress. Rising production costs for Reality Labs hardware, intense regulatory scrutiny, foreign exchange headwinds, and broader recessionary risks compound Meta's vulnerabilities, validating bearish technical forecasts and placing severe pressure on investor sentiment.

META Weekly Options Trade Plan 2025-04-16META Weekly Analysis Summary (2025-04-16)
Below is a synthesis of the analyses from all the models and a corresponding actionable trade idea:
──────────────────────────────
Comprehensive Summary of Each Model’s Key Points
• Grok/xAI Report – Noted that META’s price is well below its moving averages with a bearish MACD and near oversold RSI on the M5 chart. – Emphasized downside pressure with heavy put volume and a max pain at $540. – Recommended a bearish weekly trade with an emphasis on buying a put option—in their case, the $485 strike.
• Claude/Anthropic Report – Highlighted sustained downtrend (–13% over 5 days, –22% over 30 days) and all key EMAs trending lower. – Confirmed technical weakness with bearish MACD crossovers and RSI readings on both 5‐min and daily charts, despite a hint of potential short-term bounces. – Suggested buying a put option (their primary suggestion centered around a $480 put, though they mention liquidity and risk using nearby strikes).
• Gemini/Google Report – Noted that although META’s price touched lower Bollinger Bands and the RSI is near oversold territory, the dominant trend is bearish. – Confirmed heavy put open interest and significant recent declines. – Proposed a weekly trade buying put options near the $482.50 strike (ask ~$0.55) as the best balance between cost and risk/reward.
• Llama/Meta Report – Reiterated that technical indicators (price, EMAs, MACD, and Bollinger Bands) show a moderately bearish environment. – Favored the $482.50 put option with an ask around $0.55 because it fits within the ideal premium range and provides sound liquidity. • DeepSeek Report – Pointed to a sustained downtrend with consistent bearish signals on both the technical and sentiment fronts. – Recommended a weekly bearish put trade—selecting closely between a $485 or $482.50 strike—with defined risk targets.
────────────────────────────── 2. Areas of Agreement and Disagreement Between Models
• Points of Agreement – Every model sees META trading in a moderately bearish environment, with price action well below key moving averages and bearish MACD/Rsi signals. – All reports confirm that the short-term sentiment (supported by high volatility measured in VIX and heavy put open interest) leans toward further downside. – All agree that a weekly options trade is appropriate—and each favors a put option trade with strikes in the low-to-mid 480s range. – Liquidity and risk/reward are key, with the models collectively favoring strikes whose premiums fall in or near the ideal $0.30–$0.60 range.
• Points of Disagreement – There is a slight difference in strike selection: recommendations ranged between the $480, $482.50, and $485 puts. – Some emphasis was placed on avoiding a near-term bounce (with stop‐losses set at different levels); however, the differing exit strategies are minor and stem mostly from risk tolerance variations rather than a fundamental disagreement on the bearish bias.
────────────────────────────── 3. Clear Conclusion & Trade Recommendation
Overall Market Direction Consensus: All models converge on the view that META’s short‐term outlook is moderately bearish with technical indicators (price below major EMAs, bearish MACD, and relatively low RSI levels) coupled with the high-volatility environment pointing toward further decline.
Recommended Trade: • Instrument: META weekly options • Strategy: Buy single-leg, naked put options • Expiration: Weekly options expiring on 2025‑04‑17 • Selected Option: The $482.50 put (with an ask of ~$0.55) is favored. It offers a premium within the ideal range, and its “distance” of about 5.3% below current price fits a downward scenario. • Entry Timing: At market open • Risk/Reward Guidance: We target roughly a 100% gain (profit target around $1.10) on the premium while protecting with a stop-loss around $0.30 if the premium erodes significantly. • Confidence Level: 70% • Key Risks and Considerations: – A near-term bounce or oversold reversal (as indicated by the RSI and Bollinger Bands) could force a premature exit. – The max pain level of $540, while distant, is noted but considered less significant given the strong technical weakness. – Market volatility remains high; hence, strict adherence to the stop-loss is recommended to limit adverse moves.
────────────────────────────── 4. TRADE_DETAILS (JSON Format)
{ "instrument": "META", "direction": "put", "strike": 482.5, "expiry": "2025-04-17", "confidence": 0.70, "profit_target": 1.10, "stop_loss": 0.30, "size": 1, "entry_price": 0.55, "entry_timing": "open" }
Disclaimer: This newsletter is not trading or investment advice but for general informational purposes only. This newsletter represents my personal opinions based on proprietary research which I am sharing publicly as my personal blog. Futures, stocks, and options trading of any kind involves a lot of risk. No guarantee of any profit whatsoever is made. In fact, you may lose everything you have. So be very careful. I guarantee no profit whatsoever, You assume the entire cost and risk of any trading or investing activities you choose to undertake. You are solely responsible for making your own investment decisions. Owners/authors of this newsletter, its representatives, its principals, its moderators, and its members, are NOT registered as securities broker-dealers or investment advisors either with the U.S. Securities and Exchange Commission, CFTC, or with any other securities/regulatory authority. Consult with a registered investment advisor, broker-dealer, and/or financial advisor. By reading and using this newsletter or any of my publications, you are agreeing to these terms. Any screenshots used here are courtesy of TradingView. I am just an end user with no affiliations with them. Information and quotes shared in this blog can be 100% wrong. Markets are risky and can go to 0 at any time. Furthermore, you will not share or copy any content in this blog as it is the authors' IP. By reading this blog, you accept these terms of conditions and acknowledge I am sharing this blog as my personal trading journal, nothing more.

The past, the present, and the future. Weekly wrap upIn this video I recap last weeks wild roller coaster ride of a week in the markets. Touching on SPX, NDX, SMH, GOLD, SILVER, BITCOIN, Natgas, MSFT, AAPL, NVDA and AVGO.

Could META Be Setting Up for a Sharp Reversal?The Meta Platforms (META) chart just printed a textbook bull exhaustion. If you’re looking for high-flying tech stocks that may be due for a breather, this might be one of them.
🔎 Chart Breakdown (9W Time Frame):
Current Price: ~$510
Jan ‘25 High: $740.91
Bearish Targets:
🎯 Zone 1: $340.01 (61.8% Fib retracement)
🎯 Zone 2: $230.27
🧱 Sept ‘22 Low: $88.09 (extreme long-term support)
Technical Structure:
META saw a near uninterrupted bull run from late 2022 through early 2025
The current candle broke structure with a clear momentum shift
This looks like a repeat pattern from previous highs, signaling a potential reversal
The chart shows two key demand blocks where price could look to stabilize after correction
🚨 My Take:
META is showing the same vertical climb structure we saw on Netflix before the pullback. When growth stocks run this far, this fast, a correction is not only expected — it's healthy.
I’m not saying it’s crashing to the bottom, but a retracement to $340–230 zones makes sense based on historical price action. If you're in this for the long haul, these levels may offer better re-entry opportunities.
📌 Not financial advice — just a trader’s eye on macro structure.

Could bounce from here and may collapse laterPotential to bounce from here for the next couple of months. After bounce, if it comes back to the current level, then it could be a sign of crash. All the best !!

META Screaming CAUTION!The hardest thing is to call a short in a recession-proof stock, especially in the tech space. However, only so many dollars are available in the advertisement space, and it can't go up forever. Make this excuse at any price.
As such, I rely on the chart screaming CAUTION!
Again like most of my trade setups, this is a simple trade.
Bulls should take their profits and smile.
Bears short as high as possible with the internet to short more should it form a double top.
The chart has spoken. Like it or not.
Remember I am a macro trader so don't expect tomorrow to play out. My trades take time but have much bigger moves. ;)


META - Melt up & Crash series [3]Blue bull flag (you can't see it unless you zoom in) perfectly broke out and backtested itself creating a new low. Now up from here. All this pent up energy ready to go.
With the room on the RSI I feel it could even reach 2.618 or 3.618 (will have to react assess closer). For now we assume resistance will hold and 1.618 is target before crash.
Not financial advice.

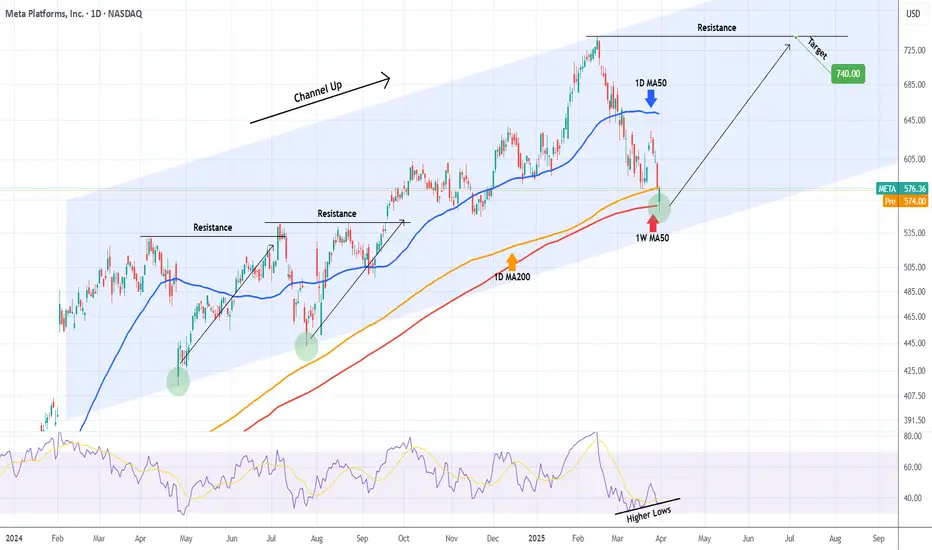
META Can it hold its 1W MA50?Meta Platforms (META) has been trading within a 1-year Channel Up and yesterday it hit its 1W MA50 (red trend-line), breaching the 1D MA200 (orange trend-line) which held the correction last week.
Even though the bottom of the Channel Up is currently $40 lower, holding he 1W MA50 is critical because it has been kept intact since the February 02 2023 bullish break-out.
The first signs are encouraging as the 1D RSI is on Higher Lows, despite the stock's Lower Lows, which is a Bullish Divergence. So as long as this Channel Up bottom Zone holds, we expect META to initiate its new Bullish Leg and test initially its previous Resistance (ATH) as it did on July 05 2024 and August 22 2024. Our Target is $740.
-------------------------------------------------------------------------------
** Please LIKE 👍, FOLLOW ✅, SHARE 🙌 and COMMENT ✍ if you enjoy this idea! Also share your ideas and charts in the comments section below! This is best way to keep it relevant, support us, keep the content here free and allow the idea to reach as many people as possible. **
-------------------------------------------------------------------------------
💸💸💸💸💸💸
👇 👇 👇 👇 👇 👇
META's NEXT BOTTOM FOR THE CORRECTION (SHORT)Meta target reached 746, the level in our previous post.
The correction is currently in progress and by the numbers an aligning bottom within the growth sequence puts the bottom at 485 level. An extended bottom below 485 will see price bottoming at 413 or 385 levels.
Trade safe

BUY FOR ONE MORE UP SWING UNTIL 2026The top is not yet, one more heavy swing up soon
buy more and hold
The panic will end and all the bulls with step forward again soon
Buy...

Global stock sell-off uh oh!This analysis is provided by Eden Bradfeld at BlackBull Research.
The stock market doesn’t really give a damn about what you think. It’s unemotional. DIS or META does not care about your feelings about them, believe it or not. You should be excited that stocks are on sale. If they are on sale even more, you should be even more excited.
You should see it as a form of extreme couponing.
And you know how excited extreme couponers get!
Everyone talks about buying when others are fearful but not many people do it. But extreme couponers, you know, they’re excited every day. Let’s try and be more like extreme couponers.
GOOG 16x earnings, NVO 17x fwd earnings, you know the drill…

Go Long on Meta: Navigating Tech's Resilience - Key Insights: Meta demonstrates
resilience amidst tech sector volatility. With key support levels holding, it
presents a potential opportunity for bullish positions driven by sector recovery
expectations and macroeconomic conditions. Pay attention to regulatory impacts
and earnings reports which could sway investor sentiment.
- Price Targets: For a
long position, aim for T1 at $600 and T2 at $630, maintaining stops at S1 of
$550 and S2 at $540 for risk management. These levels align with market
sentiment and technical analysis, offering a pathway for potential gains. -
Recent Performance: Meta has maintained its structural support despite broader
market challenges affecting the tech sector. While facing downturn pressures
alongside large-cap tech stocks, it shows robust technical setups and the
ability to hold critical support levels.
- Expert Analysis: Experts highlight
Meta's sensitivity to macroeconomic factors and sector-specific challenges.
Attention is on its technical levels, especially around the 200 SMA, ensuring
momentum is preserved. Regulatory developments in the social media space and
ByteDance's strategic moves could influence Meta.
- News Impact: Upcoming
earnings reports and regulatory issues surrounding TikTok may affect Meta's
market dynamics significantly. These events are poised to shift investor focus,
potentially impacting privacy and geopolitical sentiments within the tech
sector. Meta's upcoming earnings have the potential to either affirm or shake up
bullish sentiment further based on financial health and growth prospects.