METAthe price has been on an upward trend for 21 days, reaching a supply zone around $342.50. However, in the last three days, there has been a consistent downward movement. Currently, the price has pulled back to three levels: 50% of $311.87 and 61% of $308.89.
Your target appears to be a potential bounce back upwards from these levels, with $311.87 and $308.89 serving as support levels based on Fibonacci retracement. This is a common strategy among technical analysts who use historical price patterns and mathematical ratios to predict potential future price movements.
It's important to note that while technical analysis can provide valuable insights, it's not foolproof, and market conditions can change rapidly. Always consider combining technical analysis with other forms of analysis, risk management strategies, and staying informed about any relevant news or events that might impact the financial instrument you're trading.
Remember, investing and trading involve risks, and it's essential to do thorough research and possibly consult with a financial advisor before making any significant financial decisions.
META trade ideas

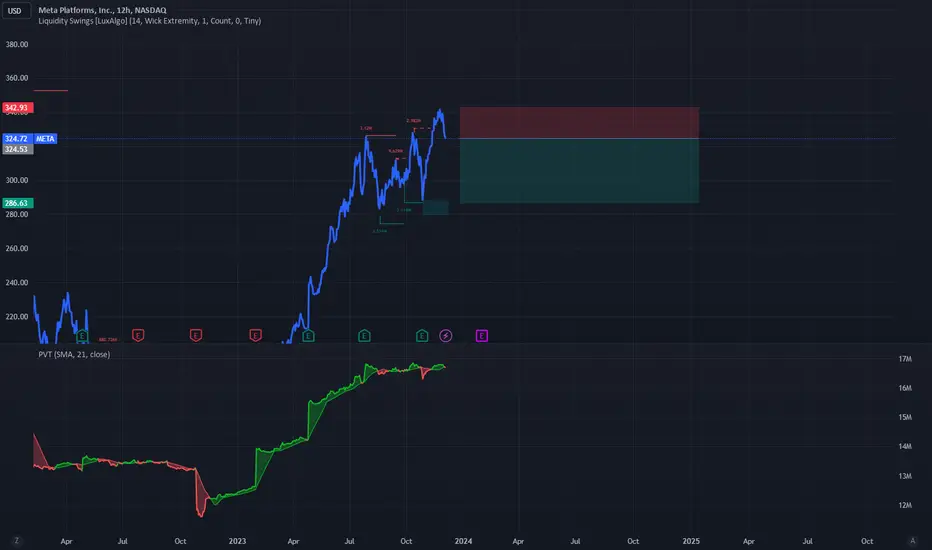
META on the Verge of CorrectionSince November 2022, the META stock has surged by over 280%, experiencing minimal pullbacks. Recently, however, the price exhibited weakness.
Considering the liquidity perspective and taking into account divergences in the Price-Volume trend, it is anticipated that the stock price will initially target the range between $286 and $287 USD.
There is also a possibility of a Liquidity Sweep occurring around $275 USD.
Therefore, we advise against opening long positions in META until the price reaches the mentioned levels. Subsequently, we anticipate a resumption of the long-term trend.
🔴 META PLATFORM: Daily Technical Analysis & SetupHi Traders!
From a technical point of view, NASDAQ:META is very interesting for Day Traders, but at the same time it could also give some opportunities to Aggressive Traders (Intraday) in short term. Having said that, if we look at Daily Chart the trend is bullish in mid-long term, but in the short term we do not exclude a bearish consolidation before another rally. For Day Traders Setup is very simple, wait for pullback to take long position as shown on the chart. Money Management also seems interesting, with a risk of 2% we get a Risk/Return Ratio > 1:8 (not bad).
🔴 INTRADAY ANALYSIS
How can we get to our Setup Area?
==============================
Now we need to understand how META could reach our Setup Area, and it could do so simply in two ways: with a bullish scenario (Top and Impulsive Structure still in play) or with a bearish scenario (ABC Pattern in play), as shown on two chart below. Both of these two scenarios should be able to reach our setup area on the daily chart:
Trade with care
Like | Share | Comment

META - is Wyckoff Distribution in Progress?Most of the big cap in NASDAQ is forming a consolidation at the current top area, including the $NASDAQ:META.
Is Wyckoff Distribution theory in progress?
Preliminary Supply occurred on June 2023 with a high volume + a big red candle.
The price continued to be uptrend, and the possibility of buying climaxed at the end of July.
During that time, Bearish Divergence appeared in the RSI Oscillator.
If recent performance is indicating an Upthrust after Distribution phase, then the trend will be a confirmed reversal to bearish bias for NASDAQ:META with the possibility being sideways (continue distribution phase) in the point 1 and 2 where in the potential sideways 2 area will provide a confirmation of red candle and high volume.
The Downtrend target will be the daily gap area at $214.
Every other support area will shown by the Fibonacci Retracement below:
Watch the $274-276 as your area of confirmation for the bearish reversal.

$META Buy Target 283NASDAQ:META Buy Target 283
Buy Target 283…
I will be doing target projections all weekend... so let me know if there are any that you want to see... This allows me to see charts I may not have seen in a while...
This is not in in-depth analysis… this is pointing to where 5-year volatility shows as an excellent entry and over the years this has been one of my strongest tools….
This is, of course, off the top of the swing high so if we push higher then this will shift and I will update accordingly.

META ( FACEBOOK) Rebound - Can the METAVERSE Follow?Facebook parent Meta’s first quarter profit and its count of daily users jumped past Wall Street’s expectations despite the company’s slowest revenue growth since going public a decade ago. Shares were up sharply in after-hours trading.
Meta cut a sharp contrast with Google parent Alphabet, which on Monday reported what analysts called disappointing earnings, with profit below Wall Street’s expectations. Google also reported a revenue growth slowdown, but for Meta this appeared to have been mitigated by an increase in daily active users that “was enough to send the shorts covering and the stock surging,”
so, good news from META, could the Real Metaverse be next?
One Love,
the FXPROFESSOR

META 1hr support zones based on volume META 1hr support zones based on volume
I prefer volume based support and resistance because it shows stronger support and resistance than just drawing lines at the bottom of candles

Wave of the day:META
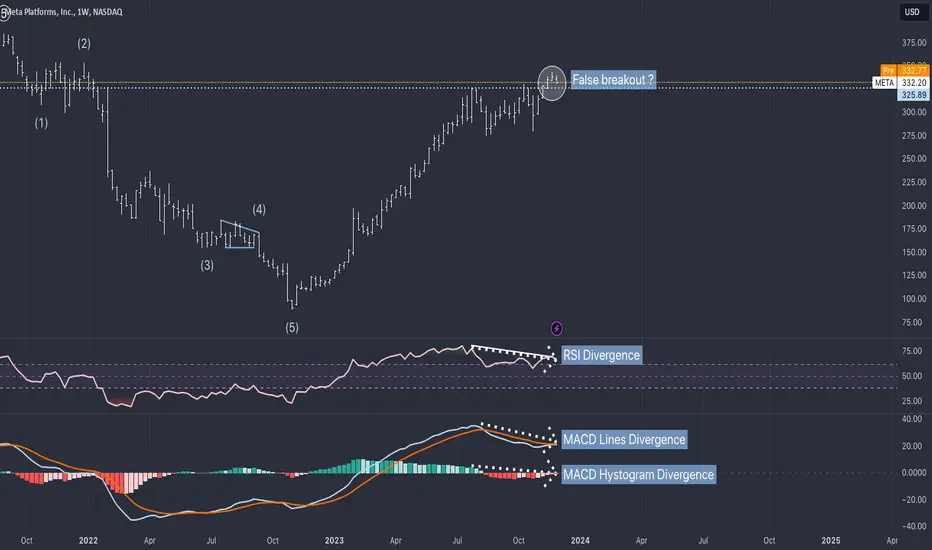
Possible false breakout in NASDAQ:META .It is not quite in place because the price is not below the top price from summer.
But if we get there below the dotted line on my graph we have a false breakout in Meta.
3 reasons why:
RSI Divergence
MACD Lines Divergence
MACD Histogram Divergence. Even though is not a pure divergence yet, we can compare the power of the bulls in summer with the power of the bulls now. Not a great sight!
What stock caught your eyes? Please leave a comment below and I will take a look next time.
Legal Disclaimer: The information presented in this analysis is solely for informational and educational purposes and does not serve as financial advice.
🚨♾Meta Platforms(META)♾ will Go Down at least ➖20%🚨🏃♂️♾ Meta Platforms(META) ♾ is moving near the 🔴 Resistance zone($332-$315) 🔴.
💡Also, we can see Regular Divergence (RD-) between two consecutive peaks .
In terms of Elliott wave theory , the Meta Platforms(META) seem to have completed the main wave 3 at the 🔴 Resistance zone($332-$315) 🔴 with the help of the Expanding Ending Diagonal Pattern .
🌊It is interesting to note that in the middle of main wave 3 , the main Bullish Long Island Pattern can be seen, which confirms our wave count.
🔔I expect the Meta Platforms(META) to lose at least ➖20% of its value after breaking the lower line of the Expanding Ending Diagonal and reaching the 🟡 Price Reversal Zones(PRZ) 🟡, Support line(1) and 🔵 200_SMA(Weekly) 🔵.
📚If you want to know about the types of Gaps , you can read the following article.👇
Meta Platforms( METAUSD) Analyze, Daily time frame⏰.
Do not forget to put Stop loss for your positions (For every position you want to open).
Please follow your strategy; this is just my Idea, and I will be glad to see your ideas in this post.
Please do not forget the ✅' like '✅ button 🙏😊 & Share it with your friends; thanks, and Trade safe.

META BUYHello, according to my analysis of Facebook stock. There is a good opportunity to buy. We note that the stock has penetrated the ascending channel. Strong resistance at 330 level has been broken. All these indicators point to buyers taking control. Inventory is for purchase only. Good luck everyone.

📚3 Reasons To Buy META Stock Options @ x1 Margin📉🚨I must emphasize that providing specific financial advice, including recommendations to buy or sell specific stocks or options,
--
goes beyond the scope of my capabilities. The information I provide should not be considered as financial advice.
--
However, I can provide you with general considerations that investors often take into account when evaluating stock options.
--
Keep in mind that investing always involves risk, and it's important to conduct thorough research or consult with a financial professional before making any investment decisions.
--
1. Bullish Outlook on Meta Platforms, Inc. (formerly Facebook, Inc.):
If you have a positive outlook on Meta Platforms, Inc. and believe that the company's stock price will rise, you might consider buying call options.
--
Call options give you the right (but not the obligation) to buy the underlying stock at a specified price (strike price) before or at the expiration date. If the stock price increases, you can
--
potentially profit from the appreciation.
2. Anticipation of a Specific Event or Catalyst:
Traders often use options to speculate on specific events or catalysts that could impact a stock's price.
--
For example, if Meta Platforms is expected to release a new product, announce positive earnings, or make a significant strategic move, options traders might take positions based on the expectation that these events will lead to a favorable stock price movement.
3. Leverage and Potential for Higher Returns:
Options trading allows investors to control a larger position of the underlying stock with a smaller amount of capital compared to buying
--
the stock outright. This is known as leverage. While leverage can amplify potential returns, it also increases the risk of losses. If the stock price moves in the desired direction, the percentage
--
gains on options can be higher than the percentage gains on the underlying stock. However, it's crucial to be aware of the risks associated with leverage, including the potential for significant losses.
Before engaging in options trading, consider your risk tolerance, investment goals, and the specific details of the options contracts you are considering. It's also important to be aware of
--
the expiration date, strike price, and premium associated with the options, as these factors can significantly impact the outcome of the trade. Always consult with a financial advisor and thoroughly understand the risks involved in options trading.
Absolutely, it's crucial to include a disclaimer when discussing financial topics. Please note the following disclaimer:
**Disclaimer:**
The information provided here is for educational and informational purposes only. It should not be considered as financial advice,
investment recommendation, or an endorsement of any specific security, company, or investment strategy. The content is based on general market information at the time of writing,
and market conditions may change. Always conduct your own research and/or consult with a qualified financial professional before making investment decisions. Trading and investing
involve risks, and past performance is not indicative of future results. The author and the platform shall not be held responsible for any losses or damages related to the use of the
information presented. Options trading, in particular, involves significant risks and may not be suitable for all investors. You should carefully consider your financial situation and consult with a
qualified professional before engaging in options trading.

META Daily with 50SMA and volume areasWouldn't be surprised to see a pullback to the 50 day. Watch these areas of volume resistance and support

Meta (NASDAQ:META) Faces Legal Heat in the U.S. and EuropeSocial media giant Meta Platforms (NASDAQ:META) is in trouble over privacy issues. In a setback for Meta, Judge Timothy Kelly of the U.S. District Court for the District of Columbia ruled that the U.S. Federal Trade Commission (FTC) can seek to lower the amount of money the company makes from users below the age of 18 years.
Price Momentum
META is trading near the top of its 52-week range and above its 200-day simple moving average.
What does this mean?
Investors have been pushing the share price higher, and the stock still appears to have upward momentum. This is a positive sign for the stock's future value.

A Positive View on META Platforms Inc. Meta Platforms (NASDAQ:META) and has recently revised the price target from $380 to $435, highlighting its innovative approach, integration of artificial intelligence, and strong financial standing as key drivers of growth.
One of the factors contributing to this positive sentiment is Meta Platforms’ recent initiatives, such as the launch of the Threads app, which is viewed as a catalyst for future growth. These developments have further solidified financial institutions that Meta Platforms is a strong buy, with a promising outlook for its future performance.
META's Positive Outlook
META’s market capitalization stands at an impressive $858.8 billion, highlighting its prominence in the technology services sector. Despite a challenging year for the company, with a negative earnings growth of -38.26% in the previous year, META has shown resilience and is projected to experience a positive earnings growth of +40.43% this year. Looking ahead, the company is expected to maintain a steady earnings growth of +20.88% over the next five years.
In terms of revenue growth, META experienced a decline of -1.12% in the previous year. However, the company’s strong market position and potential for growth are evident from its financial indicators. META’s price-to-earnings (P/E) ratio stands at 30.1, indicating that investors are willing to pay a premium for the company’s future earnings. The price-to-sales ratio of 2.79 and price-to-book ratio of 6.95 further reflect the market’s positive sentiment towards META’s prospects.
Taking a broader perspective, META operates in the technology services sector, specifically in the internet software/services industry. As a leader in this industry, META has established its corporate headquarters in Menlo Park, California, a hub for technological innovation.
Despite challenges in the past, META is expected to experience significant earnings growth this year and maintain a steady growth trajectory over the next five years. As a prominent player in the technology services sector, META’s stock performance is influenced by broader market movements and sentiment. Investors and analysts will eagerly await the next reporting date to gain further insights into META’s financial performance and growth potential.

META @ 341.49NASDAQ:META META @ 341.49
---
Be strong and take courage.
Learn the rocket booster strategy.
Hi its lubosi forex.
--
Let me share a painful story with you.
--
Have you ever felt like you don't know what you are doing?
You need to learn a trading system.
--
Fear and doubt do occupy my mind sometimes.
Do you ever feel like life is unfair to you?
--
A trading strategy will remove the doubt in your trading.
--
Disclaimer:Do not buy or sell anything I recommend to you
do your own research before your trade.
-
Rocket boost this content to learn more.

META analysisMETA is up 288% from a year ago.
-77% in 12 months
288% in the next 12 months
Funny thing is, nothing has changed fundamentally over this period.
Absolutely nothing.
Anyone who told you otherwise is mentally unstable.
If you fell for it, you have no business investing in stocks.

META FRACTAL ANALYSISWe have two repeating cycles with an expansion ratio of Phi
Price and time are analogous to the main fractal in DJIA with both tops and bottoms occurring in the same month with a +/- 1 day.
This puts the ending node of the current cycle on 26/02/2024 weekly candle with +/- 1 candle
The ending node completes a (1 X 2), (2 X 1), (3 X 2) Fibonacci growth progression of 615 weeks.
After the top is made we have a long steep correction that can run for about 57 weeks.
Trade safe, good luck

Seems like five waves up, but...... it's only now coming to a 1:1 if my count is right. Of course I am in disbelief how high this has risen, not going to pretend. I may try some puts at the marked level, gonna reach that I think - nasdaq wants a new ath.

META Buy only if this trend-line breaks.Meta Platforms (META) hit last week the top (Higher Highs trend-line) of the Ascending Triangle pattern after breaking the previous High (Resistance 1 at 330.00). This is so far the peak of the technical rally and we will buy only after 1D MA50 (blue trend-line) pull-back (1D RSI ideally on the Support Zone) or if the price closes a 1D candle above the Higher Highs trend-line first. In both cases, the bullish target will be 384.50. Until though the Higher Highs trend-line breaks, we will be selling, targeting 320.00.
-------------------------------------------------------------------------------
** Please LIKE 👍, FOLLOW ✅, SHARE 🙌 and COMMENT ✍ if you enjoy this idea! Also share your ideas and charts in the comments section below! This is best way to keep it relevant, support us, keep the content here free and allow the idea to reach as many people as possible. **
-------------------------------------------------------------------------------
💸💸💸💸💸💸
👇 👇 👇 👇 👇 👇

🤖 Meta's Latest Reveal: Advanced Generative AI
Meta has recently introduced two artificial intelligence models, Emu Video and Emu Edit. Emu Video specializes in generating brief 4-second videos from textual descriptions or initial images, while Emu Edit focuses on detailed image editing capabilities.
Meta explains that Emu Video uses a bifurcated approach, initially generating images from text, followed by stitching these into a seamless video.
Emu Edit, with its capabilities to modify backgrounds, change object colors, and introduce new elements, was developed using a specially created dataset of 10 million synthesized images.
"Unlike many generative AI models today, Emu Edit precisely follows instructions, ensuring that pixels in the input image unrelated to the instructions remain untouched," the company stated.
These new models are envisioned by developers as versatile tools for creativity, useful for artists, animators, and everyday users alike. However, at this stage, they represent an exploration of the possibilities in machine learning.
Price Momentum
META is trading near the top of its 52-week range and above its 200-day simple moving average.
What does this mean?
Investors have been pushing the share price higher, and the stock still appears to have upward momentum. This is a positive sign for the stock's future value.

Demystifying Algo Trading: A Comprehensive Guide for Beginners
In the fast-evolving landscape of financial markets, algorithmic trading, commonly known as algo trading, has emerged as a powerful and accessible tool. Today we have created a comprehensive guide for beginners, breaking down the concept, exploring its benefits, and providing insights to facilitate a successful journey into algo trading. Are you ready? Let's dive in!
Understanding Algo Trading
The Role of Algorithms- Algo trading, at its core, involves using algorithms that have predefined sets of rules and instructions to automate the process of trading financial assets. Algorithms are the engines that drive trade decision-making. Trading algorithms execute trading entries and exits of varying complexity. Understanding how algorithms function and their role in the trading process is fundamental for beginners. If you are considering utilizing a trading algorithm, understand how it functions to the best of your abilities. Understanding how an algorithm will work can help limit downside risk or other unwanted results.
Key Components of an Algo Trading System- An algo trading system is a sophisticated ensemble of components. These include data sources, where information about financial instruments is gathered; the algorithm itself, which interprets data and makes decisions; and the execution platform, which translates decisions into actual trades. Knowing these components and their interplay provides a foundational understanding of algo trading systems.
Benefits and Advantages
Speed and Efficiency- The primary advantage of algo trading lies in its speed. Algorithms can execute trades at a pace impossible for humans, capitalizing on even the slightest market fluctuations. This speed is not just a luxury but a necessity in today's fast-paced market, where opportunities and risks can arise and vanish in milliseconds.
Complex Strategy Execution- Algorithms excel at handling intricate trading strategies involving multiple parameters and decision points. This complexity, which might overwhelm manual traders, is seamlessly managed by algorithms. They can simultaneously process vast amounts of data, identify patterns, and execute trades according to predefined criteria.
Error Minimization- Emotions and errors often go hand in hand in traditional trading. Algo trading removes the emotional component, ensuring that trades are executed based on logic and predefined criteria. This absence of emotional decision-making minimizes the risk of costly errors caused by fear, greed, or hesitation.
Access to Various Markets and Asset Classes- Algorithms can be set up to trade across different markets and asset classes simultaneously. This diversification is challenging for individual traders but is a strength of algo trading. By spreading trades across various instruments, traders can manage risk more effectively and seize opportunities in different financial arenas.
Choosing the Right Algo Trading Platform
Factors to Consider- Choosing the right platform involves more than just functionality. It encompasses factors like user-friendliness, asset coverage, and backtesting capabilities. A platform that aligns with your trading goals and preferences is essential for a seamless algo trading experience. TradingView is a notable platform. TradingView stands out for its social community and advanced analysis tools, providing a holistic trading experience. Trading algorithms can be launched from nearly any TradingView chart, and signals can be sent to various exchanges to execute trades via a third-party connector.
Risk Management in Algo Trading
The Importance of Risk Management- While the speed and precision of algo trading are advantageous, they can amplify losses if not managed properly. As a trader, we must remember that the algorithm will only do what it's told to do. Implementing risk management strategies, such as setting stop-loss and take-profit levels, is vital. This aspect of algo trading is not just about making profits; it's about safeguarding your capital and ensuring longevity in the market.
Diversification as a Risk Mitigation Strategy- Diversifying trading strategies and portfolios can spread risk and prevent overexposure to a single asset or market condition. While individual trades may carry inherent risks, a diversified portfolio minimizes the impact of adverse movements in a specific instrument or sector. Diversification is a fundamental principle for risk-conscious algo traders, and this is why it is important to have algorithms trading different assets.
Realizing Success in Algo Trading
Continuous Monitoring- Algo trading is a dynamic field and not a set-it-and-forget method of trading. Each algorithm a trader runs needs to be continuously monitored for performance and functionality. A runaway algorithm can easily hurt any trader's capital. Successful algo traders adapt their strategies to changing market conditions. Avoiding over-optimization and remaining flexible are keys to sustained success. The ability to tweak algorithms based on evolving market dynamics ensures that algo traders stay relevant and effective over the long term.
Conclusion
Algo trading is not reserved for financial experts. It's a realm open to anyone willing to learn and adapt. The journey begins with understanding the basics, choosing suitable strategies, and embracing continuous learning. As you embark on your algo trading adventure, remember: it's not about predicting the future but navigating the present while utilizing the past. Happy trading!

META: Sell ideaOn META we are in a bullish channel situation. As you see on the chart we have the breakout with force the support line and the vwap indicator by a big red candle follow by a large red volume so it's mean that we will have a hight probability to have a downtrend.Thanks!

META LongMeta has exhibited a growth pattern after the correction in the market a year ago, it has benefited along the other tech giants and enjoys a relatively stable bullish trend with predictable support levels as indicated in the trade setup with Trading View. A buy order will be set at 295.50 for 10 units and a stop will be put into place at around the 270 range where previous support levels has then collapsed. Profit is estimated to run into the 340 range based on technical data that others will also be trading on. Upon reaching 320 a closer stop loss will be put into place in the green, losses will be alpha when triggered. If trend instead continues profit will be taken at 337, well under the volatility of the next battle.
