Inauguration Week: Opportunities in Meta, NZD, CAD, and $TRUMPInauguration Week: Opportunities in Stocks, Forex, and Crypto
Trump’s inauguration on January 20, 2025, marks the start of a new chapter for markets, with potential volatility from incoming executive orders.
Cryptocurrency
On January 17, 2025, Donald Trump surprised the industry by launching a meme cryptocurrency, $TRUMP, which has already reached a market capitalization of $72 billion according to Axios. Reports indicate that 80% of the token’s supply is controlled by Trump Organization affiliates, potentially adding over $50 billion to Trump’s net worth.
Forex
Some analysts predict the New Zealand and Canadian dollars could be vulnerable to US dollar strength this week, compounded by both countries set to release inflation data on January 21, 2025.
Stocks
The U.S. Supreme Court upheld a law requiring TikTok's Chinese parent, ByteDance, to divest U.S. operations. Meta, Alphabet’s YouTube, and Snap Inc. could benefit as advertisers redirect spending. However, Trump has indicated plans to issue an executive order delaying the ban, which may alter these projections unless Meta CEO Mark Zuckerberg can successfully leverage his new-found friendship with the incoming administration.
META trade ideas

META Short: Towards EarningsSimilar to my Amazon's idea, I believe that META is also going to go up to a Fibonacci extension level of around $651.66 and then start it's decline. It might also be an earnings play where it will announce earnings that exceeds expectations, gapped up, and then sell down.

META: Consolidating Near Resistance🔥 LucanInvestor's Strategy:
🩸 Short: Below $610.08, targeting $600 and $586. The MACD shows neutral momentum, and failure to hold support may trigger a decline.
🩸 Long: Above $632.94, aiming for $620 and $640. A breakout above resistance would confirm bullish momentum.
🔥 LucanInvestor's Commands:
🩸 Resistance: $632.94 — Key level to confirm a breakout and continued bullish trend.
🩸 Support: $610.08 — Immediate support; breaking below could lead to a retest of $600.
Meta (META) is consolidating just below resistance at $632.94, with MACD momentum remaining neutral. The price is above the 9-day EMA ($610.08) but struggling to gain bullish traction. A breakout above $632.94 is critical for continued upside.
👑 "Patience turns consolidation into opportunity." — LucanInvestor

META: Sell ideaOn META we are in a bullish channel situation with the break of the support line. This means that we would have a high probability of having a bearish trend over a time unit of 15 minutes.

META Consolidates Near Resistance! What’s Next for Bulls?Technical Analysis Overview:
1-Hour Chart:
* Trend: META is consolidating near $610 after rebounding from $588 support.
* Indicators:
* MACD: Displays bearish momentum, with a potential signal line crossover.
* Stochastic RSI: Overbought, suggesting a possible short-term pullback.
30-Minute Chart:
* Price Action:
* META faces resistance at $615, with immediate support near $600.
* A symmetrical triangle pattern hints at a potential breakout or breakdown depending on momentum.
Key Levels to Watch:
Support Levels:
* $600: Immediate support zone, marked by the HVL.
* $595: Strong PUT support (-4.64% GEX).
* $587.5: 2nd PUT Wall support (-2.31% GEX).
Resistance Levels:
* $615: Key resistance level and 2nd CALL Wall.
* $625: Next resistance, aligning with GEX10.
* $630-$634: Major resistance zone, including the highest positive NETGEX.
GEX Insights:
Key Gamma Levels:
* Positive Gamma Walls (Resistance):
* $615: 29.87% GEX (2nd CALL Wall).
* $625: 25.43% GEX (GEX10).
* $634: Highest positive NETGEX and CALL resistance.
* Negative Gamma Levels (Support):
* $595: Key PUT support (-4.64% GEX).
* $587.5: Significant PUT Wall (-2.31% GEX).
Options Metrics:
* IVR: 52.5, indicating moderate implied volatility.
* IVx: 45.1, near average levels.
* Call/Put Bias: Calls dominate at 29.3%, reflecting bullish sentiment.
Trade Scenarios:
Bullish Scenario:
* Entry: Above $615 with strong volume.
* Target: $625-$630.
* Stop-Loss: Below $600 to manage risk.
Bearish Scenario:
* Entry: Rejection at $615 or breakdown below $600.
* Target: $595-$587.5.
* Stop-Loss: Above $620 to limit losses.
Directional Bias:
* META’s consolidation near $610 suggests a pause before the next move. A breakout above $615 could signal bullish continuation, while failure to hold $600 may lead to a retest of lower levels.
Conclusion:
META is trading near a critical resistance zone at $615. Bulls need strong momentum to push toward $625-$630, while bears will aim to defend this level. Watch for volume confirmation and key gamma levels for actionable setups.
Disclaimer:
This analysis is for educational purposes only and does not constitute financial advice. Always conduct your research and trade responsibly.

META intraday flagbought META jan 24 635C at 5.5. looks ready to roll. this chart looks particularly interesting for trump inauguration. NASDAQ:META

META: Buy ideaOn META we would a hight probability to have an uptrend if only if we have the breakout with force the Vwap and the resistance line by a big green candle follow by a large green volume.

META: Bearish Momentum and Downside Risk🔥 LucanInvstor's Strategy:
🩸 Short: Below $586.41, targeting $550 and $520. The MACD remains negative, and the price is below both the 9-day and 200-day EMAs, signaling continued bearish momentum.
🩸 Long: Above $632.94, targeting $650 and $670. The price is still above the 200-day EMA, suggesting long-term bullish potential, but resistance at $632.94 needs to be broken first.
🔥 LucanInvstor's Commands:
🩸 Resistance: $632.94 — A critical resistance level; breaking above this could trigger a return to bullish momentum.
🩸 Support: $586.41 — A key support level; a breakdown below this could lead to further declines.
Meta Platforms is facing bearish pressure, with the MACD confirming a downtrend. A breakdown below support could lead to further declines, while a breakout above resistance may signal a reversal of the current trend.
👑 "Clarity in strategy ensures success."

Major Price Movement Incoming for META!Signalist has detected a precise pattern in NASDAQ:META trading activity, signaling that a substantial price movement is imminent. This isn’t a random fluctuation—it’s a carefully analyzed precursor to a significant market event.
📅 What to Expect:
⌛ Timeline: Anticipate a major move within the next 1 to 4 upcoming 3-hour candles.
📈 Monitor the Charts: Keep an eye on META’s price action over the next few candles.
Prepare Your Strategy: Whether you’re bullish or bearish, have your trading plan ready to capitalize on the move.

A bullish outlook for Meta next week as it aims to break resista- Key Insights: Meta has demonstrated a robust upward trend, evidenced by a
17.5% rally in recent weeks, suggesting increasing investor confidence. Key
strategic moves, such as the cessation of the fact-checking program, align
with enhancing user engagement and revenue potential. Maintaining above the
$604 support level will be crucial in sustaining this momentum.
- Price Targets: Next week targets - T1: 620.00, T2: 635.00
Stop levels - S1: 603.00, S2: 590.00
- Recent Performance: Meta's stock has surged recently, outperforming many peers
in the technology sector, indicating renewed interest and optimism among
investors, as evidenced by collaborative growth alongside major players like
Apple and Alphabet.
- Expert Analysis: Analysts maintain a bullish stance on Meta, highlighting
strategic positioning and the broader positive sentiment in the tech sector.
The media coverage has further boosted interest in the stock, contributing
to its upward trajectory.
- News Impact: The termination of the fact-checking program could significantly
enhance advertising revenues and user engagement, while the overall
technology sector strength bodes well for Meta's continued growth in the
coming weeks.

META: Bullish Momentum and Upside Potential🔥 Potential Price Targets:
🩸 Near-term Goal: $615.86 (1-2 months)
🩸 Long-term Goal: $632.94 (3-4 months)
🔥 LucanInvstor's Strategy:
🩸 Short: Below $615.86, targeting $600 and $580. The MACD shows positive momentum, but a breakdown below support could trigger further declines.
🩸 Long: Above $632.94, targeting $640 and $650. A break above resistance could lead to further gains, with bullish sentiment supported by the MACD and EMAs.
🔥 LucanInvstor's Commands:
🩸 Resistance: $632.94 — A key level for bulls to break through for further upside.
🩸 Support: $615.86 — A critical support level; a breakdown here could lead to downside movement.
Meta is showing strong bullish momentum, with the MACD and EMAs confirming an uptrend. A breakout above resistance could see significant gains, while a breakdown below support may result in a pullback.
👑 "Decisive action brings clarity."

$META long or short?Indecisive on this ticker. I like what Zuck is trying to do. This chart looks pretty nice. I’m seeing upside into the earnings and maybe this earnings NASDAQ:META will go up $50+ (hopeium). Let me know what you guys think. I want to see 700’s and honestly it could be insane, yet not so insane in this current market, to try and hit 800. Look at other tickers, NASDAQ:CRWD lost $200 in what a month? Then regained $200 or so in 2-3 months? NASDAQ:NVDA speaks for itself, NASDAQ:MSTR , these large MC names can do wild things.
Wallstreet

META,TSLA,AMZN,NVDIAAfter examining all four graphs, a question comes to mind. There's a bull market that has lasted for two years. I wonder if the profits will be evaluated in the crypto market. In this case, these tech firms will likely start to decline, but who knows?

META ... Facebook has many elevator floors to go downHere is a simple review of a parallel channel and a fib extension trend to better show how the past presented facebook with a slap on the face and may of booked its top and sent it forever flying down....but who knows...

Meta Platforms Inc. (META): Consolidation Near Resistance, Eyein🔥 Potential Price Targets:
🩸 Near-term Goal: $630.00
🩸 Long-term Goal: $650.00
🔥 LucanInvestor’s Strategy:
🩸 Long: Above $632.94, targeting $640.00 and $650.00. Momentum supported by strong volume needed for a sustainable breakout.
🩸 Short: Below $608.63, aiming for $600.00 and $586.00. Weak MACD suggests downside risks if support is breached.
🔥 LucanInvestor’s Commands:
🩸 Resistance: $632.94. Breaking this level may signal a move toward $650.00.
🩸 Support: $608.63. A breakdown could pave the way for further declines.
Meta Platforms has shown mixed momentum as investors assess recent news and sector trends. MACD remains neutral, but watch for breakout or breakdown signals at critical levels.
👑 "Consolidation isn't stalling—it's preparation for the next move." — LucanInvestor


" Breakout Alert: Key Levels to Watch for Your Next Trade! "
Moving Average Channel (20 High and 20 Low):
The price is currently trading between the 20 High (red line) and 20 Low (white line), suggesting a squeeze or consolidation phase.
A breakout above or below this channel could indicate the next directional move.
Current Bias:
The price has tested the lower end of the channel (near $609), showing buyers stepping in to defend this level.
The price is attempting to push back toward the 20 High (red line) but faces resistance there, which aligns with the bearish momentum from earlier candles.
Trading Scenarios Based on the Channel:
1. Bullish Scenario (Break Above the 20 High):
If the price breaks and closes above the 20 High (red line), it may signal a bullish move.
Target: $620 (short-term resistance) or higher, depending on the momentum.
Volume confirmation is key for a sustained move upward.
2. Bearish Scenario (Rejection at the 20 High):
If the price fails to break above the 20 High, expect a possible test of the 20 Low (white line) or lower.
A breakdown below the 20 Low could open the door for further downside, targeting $603 or beyond.
3. Range Scenario (Between 20 High and 20 Low):
The price may continue to trade within the channel until a clear breakout or breakdown occurs.
In this case, you could use the 20 High as dynamic resistance and 20 Low as dynamic support for range-bound trades.
Additional Notes:
Breakout vs. False Breakout: Watch for a clean breakout (candle closing above/below the 20 High/Low) instead of a wick.
Momentum Check: Look for volume to confirm the validity of moves outside the channel.
Dynamic Trend: Since the 20 High and Low are dynamic, adjustments may be needed as new candles form.

META Technical Analysis and GEX Insights-Jan. 8
Technical Analysis (30-Minute Chart and 1-Hour Chart)
* Trend and Price Action:
* META is forming a symmetrical triangle pattern, indicating consolidation and potential breakout soon.
* The price recently rejected $637.39 (key resistance) and is now trading near $618.00, testing short-term support.
* Volume: Moderate volume on the pullback, indicating consolidation rather than aggressive selling.
* Indicators:
* MACD: Bearish divergence on the 30-minute chart, with the histogram moving downward, suggesting decreased momentum.
* Stochastic RSI: Near oversold levels, pointing to a possible short-term bounce.
* Key Levels:
* Support Levels:
* $618.00: Immediate support; a breakdown could test the $607.50-$600.00 zone.
* $600.00: A critical support level with GEX data showing PUT concentration.
* $595.00: Major support zone below $600, aligning with historical price action.
* Resistance Levels:
* $637.39: Key resistance and recent high, aligning with GEX CALL walls.
* $645.00: Secondary resistance zone; breaking above could lead to $650.00.
GEX Insights for META
* Gamma Exposure (GEX):
* Positive GEX Zones:
* $637.00-$645.00: Significant CALL wall activity, serving as strong resistance for price action.
* $650.00: Highest positive gamma exposure, representing a potential target for bullish momentum.
* Negative GEX Zones:
* $607.50: Key PUT wall and immediate support level.
* $600.00-$595.00: Critical support cluster with the highest negative gamma exposure, indicating strong defensive positioning.
* Options Metrics:
* IVR (Implied Volatility Rank): 53.5%, indicating moderately elevated options pricing.
* Options Flow:
* CALLs: Dominant around $637 and $645, reflecting resistance levels.
* PUTs: Concentrated below $600, highlighting significant hedging activity.
Trade Scenarios:
Bullish Scenario:
* Entry: Above $620.00 with confirmation of bullish momentum.
* Target: $637.00 (initial), $645.00 (extended).
* Stop-Loss: Below $615.00 to limit downside risk.
Bearish Scenario:
* Entry: Below $607.50 with strong selling volume.
* Target: $600.00 (initial), $595.00 (extended).
* Stop-Loss: Above $612.00 to cap losses.
Conclusion
META is consolidating within a symmetrical triangle, with $607.50 acting as immediate support and $637.00 as the critical resistance. A breakout above $637 could drive prices toward $645 or $650, while a breakdown below $607 could lead to increased selling pressure. GEX data confirms these levels as pivotal zones for price action.
Disclaimer: This analysis is for educational purposes only and does not constitute financial advice. Always conduct your own research and manage risk responsibly.
Let me know if you'd like further insights or adjustments!

The future of Meta $NASDAQ:META META is recovering from a double bottom (market reversal pattern) heading north. Opportunity to buy on the pull back to maximize your money.

Meta Platforms (META): At a Crossroads🩸 Long: Above $632.94, aiming for $640 and $650. Momentum from buyers must break resistance to confirm the uptrend.
🩸 Short: Below $608.01, targeting $600 and $590. Increased selling pressure could lead to further declines.
🩸 Resistance: $632.94 – The ceiling for bulls to breach.
🩸 Support: $608.01 – A breakdown here could spark a correction.
META is hovering near pivotal levels. While the MACD is showing a mixed signal, a decisive move above resistance or below support will set the tone for the next trend.
👑 "Precision at key levels separates leaders from followers." — LucanInvestor NASDAQ:META

My FOMO Nightmare: How Missing One Trade Changed My Trading LifeI remember the day like it was yesterday. I was scrolling through X (Twitter), seeing everyone go wild over this one stock. My heart raced as I watched the price skyrocket, but I hesitated. I hadn't done my homework on this one, and something felt off. But the fear of missing out? That was eating at me.
The next day, I woke up to see the stock had crashed. My initial relief turned into regret. Maybe I could've sold at the peak if I had just jumped in like everyone else. That's when FOMO, or Fear Of Missing Out, became my trading nemesis:
-Hasty Actions: I started jumping into trades at the last minute, driven by the buzz on social media, not by my own analysis.
-Screen Addiction: I couldn't step away from my screen, worried I'd miss the next big move. My life began revolving around the market's every twitch.
- Chasing Losses: After missing a few opportunities, I found myself in a dangerous cycle, trying to make up for lost gains with even riskier trades.
But here's the twist in my story. One evening, after a particularly bad day of chasing trends, I sat back and realized how this fear was controlling me, not my strategy. I decided to change. I set strict rules for myself: no trading based on social media hype, sticking to my research, and remembering that every market has its patterns - there's always another chance if you miss one.
Now, I trade with a calm mind, knowing that if I miss one trade, there'll be another. If you've ever felt that burning desire to join the rush, only to regret it later, you're not alone. Let's share our stories and strategies for overcoming FOMO. DM me if you want to chat about how we can keep our heads in the game, not just our eyes on the screen.
Kris/ Mindbloome Exchange
Trade What You See

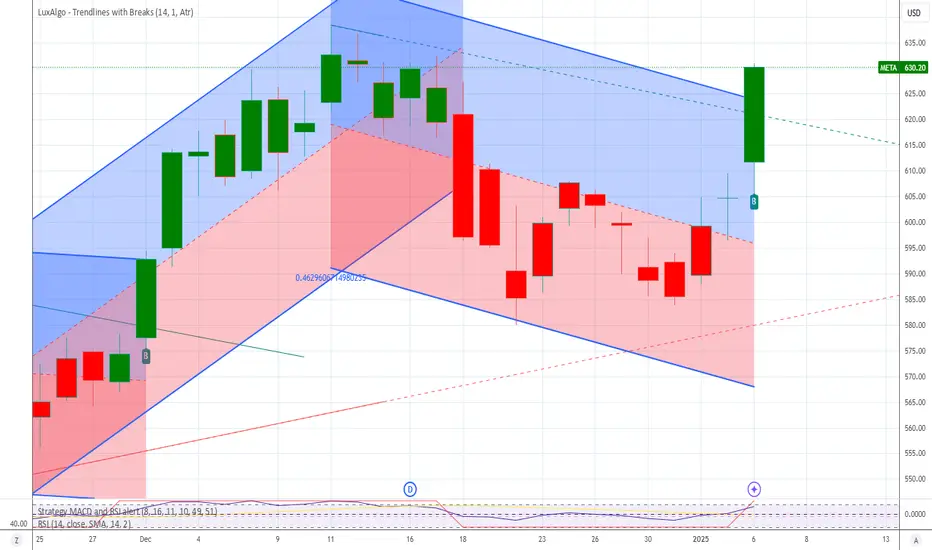
META Long on Regression BreakMETA has broken it's regression break and the other magnificent 7 have already or are about to break
META trend ending !?possibly a perfect short entry, 2 monthly topping tails in the last 3 month indicating exhaustion and a possible trend reversal, targets will be 550 - 380 and possibly 250.
will be accumulating shorts from here up to 650 with stop a monthly close above 650
