Is MRK Setting Up for a Major Comeback? 🧬Merck & Co. (MRK) is trading around $81.00 down significantly from its 52-week high of $134.63 but this pullback could be your window of opportunity. With a solid forward P/E of 9.02, a 3.9% dividend yield, and a pipeline packed with over 20 potential blockbuster drugs, the fundamentals remain str
Key facts today
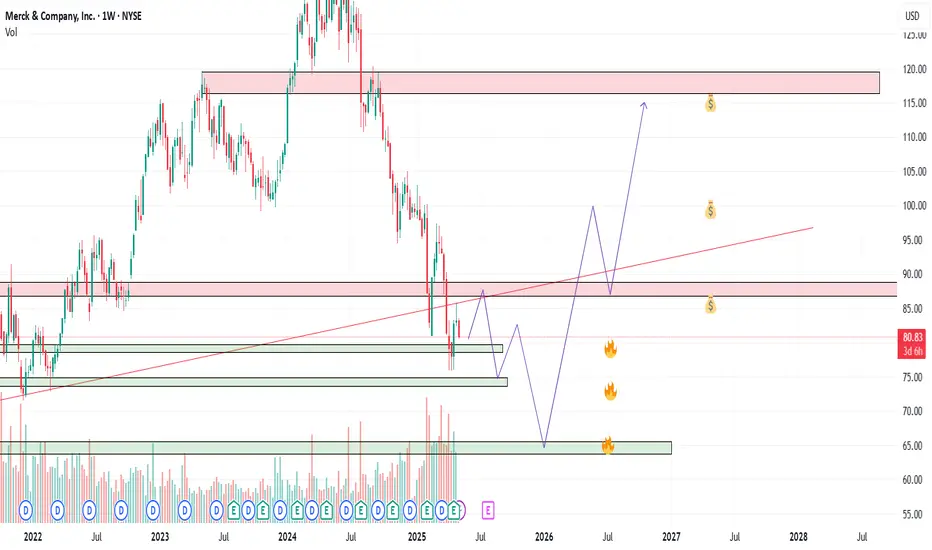
MERCK Stock Chart Fibonacci Analysis 042525Trading Idea
1) Find a FIBO slingshot
2) Check FIBO 61.80% level
3) Entry Point > 82/61.80%
Chart time frame: D
A) 15 min(1W-3M)
B) 1 hr(3M-6M)
C) 4 hr(6M-1year)
D) 1 day(1-3years)
Stock progress: A
A) Keep rising over 61.80% resistance
B) 61.80% resistance
C) 61.80% support
D) Hit the bottom
E

MRK Merck Options Ahead of EarningsAnalyzing the options chain and the chart patterns of MRK Merck prior to the earnings report this week,
I would consider purchasing the 80usd strike price Calls with
an expiration date of 2026-1-16,
for a premium of approximately $8.50.
If these options prove to be profitable prior to the earnings

Undervalued, Oversold, Overlooked: MRK Hits The Key Zone!Hi all,
Merck & Co. (MRK) is a global pharmaceutical titan and is currently trading near its 52-week low of ~$79. Anchored by Keytruda’s 7% YoY revenue growth, a stable ~4% dividend yield, and an average fair value estimate of $156.59 (98% upside), MRK appears significantly undervalued.
Analysts f

Merck Wave Analysis – 8 April 2025- Merck broke strong support level 81.30
- Likely to fall to support level 75.00
Merck is under bearish pressure after breaking the strong support level 81.30 (the former monthly low from February, which stopped the earlier impulse wave 1).
The breakout of the support level 81.30 should accelerate

Merck & Co. (NYSE: $MRK) Sets Up Q125 Earnings Call for April 24Merck & Co. (NYSE: NYSE:MRK ) will hold its Q1 2025 earnings call on April 24 at 9:00 a.m. ET. Company executives will present financial results and performance updates during the call.
As of April 4th, 2025, MRK closed at $81.47, down $4.92 (5.70%). The stock has declined steadily since peaking at

MRK BEARISH BACK DOWN TO 87Full-time frame continuity across several higher timeframes, and a possible reversal happening on the 4h chart. Has a risk/reward ratio of 2:1.

How and When to switch from Selling Short to Buying Long Often times when the market is in a panic selling mode or trending down in a correction, stocks fall below their fundamental values. When that happens traders need to quickly close their sell short positions with buy to cover orders and prepare to start swing trading the velocity or momentum runs th

Swing Long on Merck & CoI'm going long here on this healthcare company. Looking good for a rebound soon.

MRK 5M Long Investment Aggressive CounterTrend TradeAggressive CounterTrend Trade
- short impulse
+ exhaustion volume
+ volumed T1
+ volumed 2Sp-
+ weak test
+ first bullish bar closed entry
Calculated affordable stop limit
1/2 1M take profit
Hourly CounterTrend
"- short impulse
+ 1D SOS level"
Daily Trend
"+ long impulse
+ SOS level
- before 1/2

See all ideas
Displays a symbol's price movements over previous years to identify recurring trends.


