I am scare to take this trade .... must be the one This channel is not providing individualized trading or investment advice, nor is it a banking service, brokerage service, trading service, investment service or money management
service.
It is just an educated guess.
MSTR trade ideas


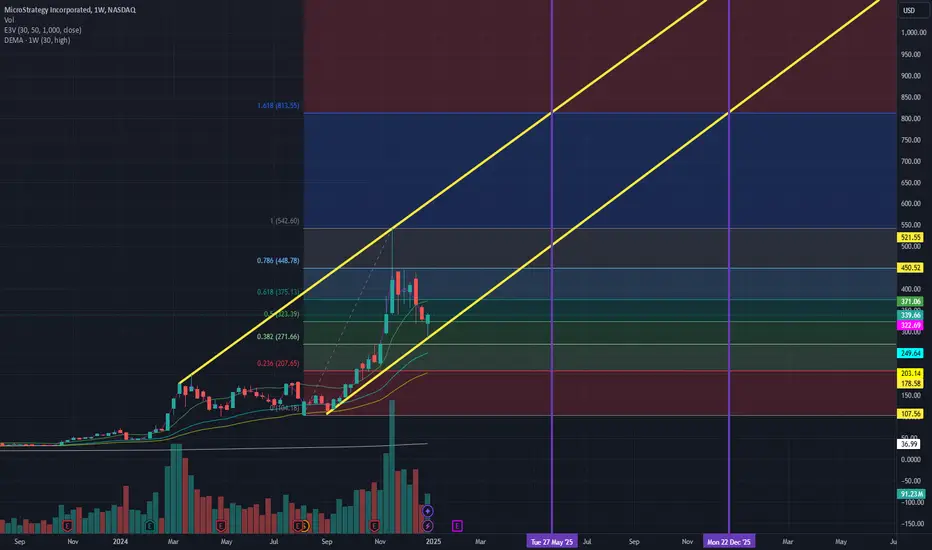
$MSTR Continues to FLY to $800. if BTC breaks 100K, CLEAR SKIESThere seems to be the idea that BTC held strong at $92K. We saw a bounce to FWB:98K and MSTR bounced off a similar key level.
Based on this trend, as well as the continued crypto regulation news, we can potentially see MSTR being the next 3x runner in the year IF BTC breaks 100K once again, suggesting further new highs.
This trend would suggest that we can see MSTR $800 by as early as MAY. or some potential consodilation during the summer, with a final blowout in late DEC 2025.
What do you think is the new BTC / MSTR target?
MSTR: Bullish Momentum Faces Key Resistance🔥 LucanInvstor's Strategy:
🩸 Short: Below $335.13, targeting $320 and $300. The MACD shows weakening momentum, and the price is approaching key resistance at $399.88.
🩸 Long: Above $363.01, aiming for $399.88 and $410. A breakout above this resistance could extend the bullish trend, but the weakening MACD signals uncertainty.
🔥 LucanInvstor's Commands:
🩸 Resistance: $399.88 — A key resistance level; if broken, the bullish trend may continue.
🩸 Support: $335.13 — A critical support level; a breakdown below this could lead to further declines.
MicroStrategy's bullish momentum has paused near resistance. If the price holds above key support levels, a breakout could occur. However, the MACD indicates weakening bullish strength.
👑 "In moments of uncertainty, discipline and precision will guide your actions."

Opening (IRA): MSTR 180/210/410/440 Iron Condor... for a 6.03 credit.
Comments: High IV at 95.8%. Here, going delta neutral, 1/10th the price of the underlying for my wing width, and setting up my short option strikes at the 16 delta on both sides.
Metrics:
Max Profit: 6.03
Buying Power Effect: 23.97
ROC at Max: 25.16%
50% Max: 3.02
ROC at 50% Max: 12.58%
Will generally look to take profit at 50% max; roll in untested side on side test.

MSTR - Can I BUY now?NASDAQ:MSTR seems to have found a base at my ideal target for w4. (Would have been great if I managed to publish it ;/)
To keep this brief, I like this area as a base before finding higher.
Goo dLuck!

Major Price Movement Incoming for MSTR!Signalist has detected a precise pattern in NASDAQ:MSTR trading activity, signaling that a substantial price movement is imminent. This isn’t a random fluctuation—it’s a carefully analyzed precursor to a significant market event.
📅 What to Expect:
⌛ Timeline: Anticipate a major move within the next 1 to 4 upcoming 3-hour candles.
📈 Monitor the Charts: Keep an eye on MSTR’s price action over the next few candles.
Prepare Your Strategy: Whether you’re bullish or bearish, have your trading plan ready to capitalize on the move.

Why MicroStrategy Will FailIf you listen to Michael Saylor, watch what he is doing with his financial engineering, and "learn about Bitcoin" it seems incredibly obvious that... MicroStrategy WILL NOT fail . At least, that is what I have been told by those that stand to gain massively from Bitcoin's price appreciation. It makes a lot of sense: corner the market of Bitcoin supply => force the price into "discovery" mode and everyone that believed in him and Bitcoin will be rich to the point they feel they deserve for being so prescient with their wisdom.
The history of finance does not bode well for such absolute certainty...
I began shorting Microstrategy with Puts over a year ago. "Being early and being wrong are often indistinguishable in trading/investing." I've lost money. But that did not dissuade me from calling BS on this scheme.
Up until November 22, 2024 it had been a small trade that had not worked out so far. But on that day Saylor gave a CNBC interview (highly recommend looking it up) where he talked about their "core business", their "Bitcoin reactor", "selling volatility", and lots of complex financial jargon. To some, this might come across as brilliance. To me, having been in markets for a long time and studying their history it was patently obvious he was doing the classic, "if you can't amaze with brilliance then dazzle with bullshit" tactic. This was not a scam, nor a ponzi, nor a fraud... in absolute terms. We don't actually have a word for it. But it needs a derogatory term because people are going to lose money buying into it.
I don't believe in karma. What I believe is that people cannot help be themselves and repeat their character flaws and patterns. This is not the first time Saylor has engaged in "financial engineering". Over 20 years ago MSTR (same company, same symbol) got caught by the SEC for doing much the same thing a Enron in their accounting practices. They were levied a big fine and the stock dropped -60% in a single day. Roughly two weeks later... the entire dot-com bubble imploded. Was MSTR the catalyst for this collapse? Unknown. But it certainly did not help keep the bubble going...
Once again Saylor is exploiting the financial system. Or as gamers would call it; "clever use of game mechanics." There is nothing illegal about what he is doing (that is apparent). It's all out in the open. But it's leverage. Lots of leverage. MSTR ran out of simple debt and have found other ways to make cash to buy Bitcoin. Every week they keep "buying the top" as cheerleaders for this asset; Bitcoin. Trying to get others to join in their crusade to... I guess get it to $1 million now. Still valuing it in fiat terms while claiming to be changing finance (do they still want to do that anymore with Blackrock being their best backer? Unknown.
I left all my Bitcoin Maxi chats as part of a New Year's Resolution to argue less with people on the Internet after 2024. When I left I was still defending my short while they were eagerly buying the dip. With all investments... time will tell.
The Trade
I have been purchasing Puts in different traunches with different strikes going out all the way to 2027. These long term Puts have their theta offset by selling shorter duration options to keep myself theta positive. This has been great over the last 2 months with increased IV. During the recent drop to $285 I actually found myself delta positive for a day. I wanted to get "more short" and added as much risk as I felt comfortable on the last push up to $380. Now delta negative/theta positive.
Where I stop out: $390 is a key volume profile level topside. If price gets back above there I consider myself wrong... for now... and start to unwind risk or hedge more
How I manage: I will continue to manage my delta/theta as long as IV makes it fun while always trying to stay negative. Buy long dated puts on pops up; Sell some Puts on every move down. The goal is for MSTR's debt to start getting called this year and they be forced to make some hard choices. This may require Bitcoin and/or the equities market to collapse in 1-2 years. If so; MSTR will be hurt tremendously.

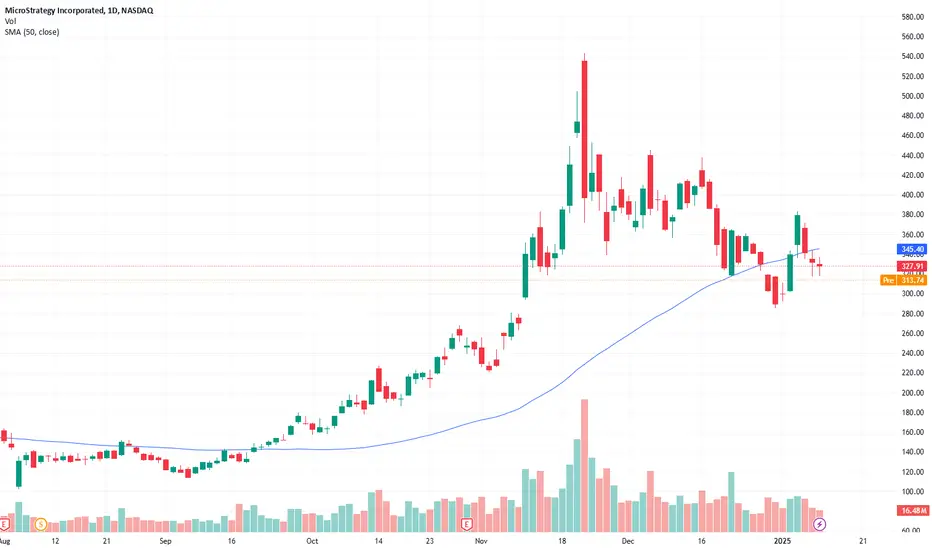
Long MSTR: Watch for Key Breakouts Next Week
- Key Insights: MicroStrategy's stock remains sensitive to Bitcoin's price
fluctuations, with a current sentiment hinting at a potential recovery if
Bitcoin stabilizes. A breakout above $338.76 could signal a bullish trend,
while drops below $316.93 could lead to further losses. Anticipation
surrounds a crucial shareholder vote on January 21st, which could
significantly affect future stock performance by allowing more Bitcoin
acquisitions. Investors should monitor Bitcoin's market dynamics and perform
thorough risk assessments considering the stock's volatility.
- Price Targets: Next week targets: T1: $340, T2: $360; Stop levels: S1:
$316.93, S2: $310.
- Recent Performance: MSTR has seen significant moves, declining approximately
40% from recent highs and reflecting investor concerns about its
cryptocurrency-heavy strategy. The fluctuations in Bitcoin's valuation have
directly impacted MSTR's stock performance, leading to increased volatility
in trading activity.
- Expert Analysis: Analysts maintain a cautiously optimistic outlook for MSTR,
balancing skepticism over its substantial Bitcoin emphasis with the
potential for positive returns if Bitcoin prices rebound. Market sentiment
nudges towards bullish, influenced by expected increases in Bitcoin value
amidst investor speculation. The critical resistance and support levels will
likely drive short-term trading decisions.
- News Impact: The upcoming shareholder vote on January 21st is expected to be a
weighty factor, potentially enabling MicroStrategy to pursue more aggressive
Bitcoin acquisition strategies. The company has successfully raised capital
through convertible debt, signaling a continued commitment to its ambitious
investment plan amid scrutiny about volatility and regulatory changes in the
cryptocurrency market. Investors are urged to assess risks associated with
MicroStrategy's approach while tracking Bitcoin's performance closely.
MSTR keeps digging its own grave.Well, since my last post about MSTR, the trolls have been having a field day.
What a blast! §8-)
I stand by my previous post about MSTR because, honestly, I see no future in this SCAM.
Especially now that Bitcoin is teetering on the edge of a deep pullback (see my last post about Bitcoin for more).
So, what do we have here?
MSTR broke through the centerline and tried to claw its way back up.
Then came the decisive breakdown.
An open and close below the centerline paved the way for a trip south.
Thanks to more hype and yadda-yadda reports, we saw a pullback up to the centerline — which, by the way, was perfectly in line with the trading framework of forks.
But after that failed pullback, the price went the other way, and MSTR has been digging its way further south.
For those who took profits at the 1/4 line, you can now look forward to PTG2 with confidence.
Or, if you’re convinced that MSTR is headed for a reckoning with regulators in the medium term (although that seems doubtful since they all seem to be napping...), you might consider doubling down on your short position.
Wishing everyone a profitable and exciting new trading week!

MSTR: Bearish Momentum with Potential for Pullback🔥 Potential Price Targets:
🩸 Near-term Goal: $327.91 (1-2 months)
🩸 Long-term Goal: $375.00 (3-4 months)
🔥 LucanInvstor's Strategy:
🩸 Short: Below $327.91, targeting $320 and $300. The MACD is negative, and the price is below the 9-day EMA, signaling further downside in the short term.
🩸 Long: Above $375.00, targeting $380 and $390. A breakout above resistance could resume the bullish trend, supported by the price being above the 200-day EMA.
🔥 LucanInvstor's Commands:
🩸 Resistance: $375.00 — A key resistance level; a break above this could trigger further upside.
🩸 Support: $327.91 — A critical support level; a breakdown below this could lead to a pullback.
MicroStrategy faces bearish momentum in the short term, confirmed by the MACD. A breakdown below support may lead to further declines, while a breakout above resistance could drive the stock higher in the longer term.
👑 "Strategize with purpose and precision."

SOY 2024 - MSTR Monthly Seasonality StatsThe chart for MSTR (MicroStrategy) displays significant volatility and seasonal trends from 2015 to 2024. The stock tends to show strong positive performance in January, with notable gains in 2020, 2021, and 2023, aligning with the broader market optimism at the start of the year. However, February and March have been less consistent, with MSTR seeing significant declines in those months during 2018, 2022, and 2023. April and May also display mixed returns, with notable performance spikes in 2019 and 2020, although May often struggles. The summer months of June and July have historically been volatile, with substantial drawdowns in 2022 and 2023, especially during crypto winter, a period of declining cryptocurrency values. August continues this trend of volatility, while September remains a weak month, consistently underperforming.
One of the key factors affecting MSTR is its direct exposure to Bitcoin, as the company holds substantial Bitcoin reserves. This connection makes MSTR highly sensitive to cryptocurrency market fluctuations, contributing to its increased volatility, particularly during crypto downturns. Notably, MSTR’s performance has been volatile during periods of crypto market stress, such as in 2022 and 2023.
The inclusion of MSTR into QQQ (Nasdaq-100 ETF) further magnifies this risk, as the ETF’s performance is now somewhat tied to MSTR's volatility. When MSTR’s Bitcoin holdings underperform or experience a significant decline, it can drag down the performance of QQQ , which could introduce more volatility into the tech-heavy ETF. This could lead to discrepancies in returns between QQQ and SPY , especially in periods when cryptocurrency struggles. The market's growing dependence on MSTR’s performance could make QQQ more sensitive to crypto market cycles, exacerbating its volatility compared to other more diversified ETFs like SPY .

MicroStrategy In TroubleI REPEAT ONCE AGAIN.
It is NOT looking promising for MicroStrategy (which Bitcoin tracks).
Who is buying this right now?

MSTR back to the $400s | 7:1 RatioNASDAQ:MSTR has formed an inverse head and shoulders pattern on the 1-hour chart. Given that moves like this often depend on CRYPTOCAP:BTC 's price action, it's something to keep an eye on.
However, with NASDAQ:MSTR having dropped from nearly $500 per share, I believe we are in good value territory. Additionally, this trade offers a 7:1 risk-to-reward ratio if we attempt to front-run the completion of the pattern.

MicroStrategy and Bitcoin still in correction modeMicroStrategy and Bitcoin still in correction mode on weekly time frame.
I repeat, low risk entry points are not found here.

Possible downtrend for $MSTRWe observe that NASDAQ:MSTR is breaking out of a zone that could determine the downtrend. This is also visible in the Dynamic RSI, which shows a continuous decline. Additionally, the current news for BTC is not favorable, suggesting that BTC could gradually decrease. This might mark the beginning of an Altcoin season. Since NASDAQ:MSTR holds a significant amount of BTC, this has a substantial impact on its stock price, potentially causing it to fall into the resistance zone.

MSTR - It just touched the point and V-shaped recovery.Given it is a holiday everyone will take the bitcoin up, we will be having a beautiful weekend.

MSTR may test 313 and then move back to 380 by end of the week.Today is a reaction to the economic data, given there is a planned purchase from Microstrategy for additional 2 billion; the stock may temporarily see a low of 313 based on fib retracements and continue to move back up to 380 levels or higher at the end of the week.

MicroStrategy Incorporated (MSTR): Balancing Between Rebound andNASDAQ:MSTR
🔥 LucanInvestor’s Strategy:
🩸 Long: Above $363.01, targeting $380 and $399. Momentum needs to confirm with strong volume.
🩸 Short: Below $337.78, targeting $320 and $300. Selling pressure could escalate further.
🔥 LucanInvestor’s Commands:
🩸 Resistance: $363.01. A breakout may reignite bullish momentum towards $380.
🩸 Support: $337.78. A breakdown risks pushing towards $320.
Despite recent recovery attempts, MicroStrategy faces critical levels. MACD remains in negative territory, highlighting caution. Volume support will be key for any sustained moves.
👑 "Success comes to those who can act decisively in uncertain times." — LucanInvestor

MSTR....gravity is hard with this oneMSTR had some wings for a bit, but everyone knows it's not an eagle and it's flying too high. Next few hours we'll see a bit of a correction and taking a position on MSTZ to take advantage of the swing. All major technical indicators point to the spike, but profit taking will prevail and it will crash until the support level is reached.
Best of luck and always do your own dd!

MSTR vs BTCThis is a MicroStrategy vs Bitcoin comparison chart. I multiplied MSTR shares x 500 to get an average value of MSTR in relation to BTC over the last 4 years. As you can see, as of October 2024, MSTR had a massive disconnect compared to BTC's price action. I see this as a red flag and reason to take caution going long MSTR while it's so overvalued compared to BTC. It's my speculation that MSTR trading momentum won't slow down until there's a catastrophic collapse of MSTR share price for an unknown reason in the future. Until then, trade long with proper risk management and plan accurate short entry positioning. On the average day MSTR moves +40 -40 from high to low according to the ATR indicator 20 moving average.
MSTR = white
BTC = blue
Options data:
1/10/25 expiry
Put Volume Total 115,980
Call Volume Total 369,028
Put/Call Volume Ratio 0.31
Put Open Interest Total 122,469
Call Open Interest Total 245,015
Put/Call Open Interest Ratio 0.50
1/17 expiry
Put Volume Total 68,578
Call Volume Total 95,060
Put/Call Volume Ratio 0.72
Put Open Interest Total 540,322
Call Open Interest Total 305,998
Put/Call Open Interest Ratio 1.77
1/24 expiry
Put Volume Total 7,154
Call Volume Total 11,078
Put/Call Volume Ratio 0.65
Put Open Interest Total 20,348
Call Open Interest Total 14,009
Put/Call Open Interest Ratio 1.45

MicroStrategy FEAT BTC $500 by 2025 Bitcoin Investment Strategy: MicroStrategy has heavily invested in Bitcoin, making it the largest corporate holder of the cryptocurrency. If Bitcoin's value appreciates significantly, as it has in past cycles, this could directly boost MicroStrategy's stock price due to the large unrealized gains on its balance sheet. Posts on X mention the company's Bitcoin holdings as a major influence on its stock performance.
S&P 500 Inclusion: There's speculation that MicroStrategy could be included in the S&P 500, which would likely result in substantial capital inflows from index funds and ETFs. Analysts like Willy Woo have speculated that this could lead to $10-15 billion in inflows, potentially driving the stock price higher. This is discussed in web results where potential S&P 500 inclusion is seen as a catalyst for MSTR to reach $500.
Accounting Rule Changes: New accounting standards from the Financial Accounting Standards Board (FASB) effective from 2025 will allow MicroStrategy to report unrealized gains on its Bitcoin holdings, potentially boosting reported earnings and making the stock more attractive to investors. This change could qualify MicroStrategy for the S&P 500 if it reports positive earnings, as noted in several web results.
Capital Raising and Shareholder Votes: MicroStrategy plans to raise significant capital for further Bitcoin purchases, with a shareholder vote to increase the number of authorized shares dramatically. This strategy, including the $42 billion capital plan, could fund more Bitcoin acquisition, potentially increasing the value of the company's assets. Discussions on X highlight this as a move that could lead to a significant run-up in stock price.
Market Sentiment and Bitcoin Cycles: The stock market's perception of MicroStrategy as a Bitcoin proxy means that bullish sentiment towards Bitcoin often translates into gains for MSTR. If Bitcoin experiences another bull run, as some analysts predict, MicroStrategy's stock could follow suit, especially given its aggressive Bitcoin acquisition strategy.
Leverage and Bitcoin Yield: MicroStrategy's use of leverage to increase its Bitcoin per share (BTC Yield) is another factor. By selling shares at a premium over net asset value (NAV) and using the proceeds to buy more Bitcoin, the company can reduce leverage while increasing its Bitcoin holdings per share, which could drive stock price appreciation. This strategy is highlighted in posts on X discussing MicroStrategy's unique approach to Bitcoin investment.
Institutional Adoption of Bitcoin: If larger institutions or even governments start adopting Bitcoin as part of their reserves or investment strategy, this could elevate Bitcoin's price, directly benefiting MicroStrategy. There's mention of possible U.S. government involvement with Bitcoin, which could further fuel this scenario.

MICROSTRATEGY a pyramid ponzi.Understanding the situation with MSTR can be quite complex.
Many people recognize that MicroStrategy has been issuing convertible bonds at a 0% interest rate to purchase Bitcoin. This strategy tends to drive up both Bitcoin's price and the value of MSTR shares.
As a result, the scheme appears to inflate continuously, placing the risk on bondholders. The only way for MSTR's stock price to keep rising is through the issuance of increasingly larger amounts of convertible debt; otherwise, the entire pyramid would collapse.
It's understandable why Michael Saylor seems to be focusing more on shilling MSTR bonds instead of Bitcoin itself.
Why would institutions invest in MSTR's convertible bonds at 0%?
Many believe it's because they anticipate being able to convert these bonds into MSTR stock in five years at a predetermined price, potentially around $675, effectively giving them a premium-free call option. However, there is a hidden cost to this strategy: inflation. At first glance, this might seem like a poor investment choice—if one expects MSTR's value to rise, it would make more sense to buy the shares now rather than commit funds to a higher price in the future.
Why would anyone engage in such a massive financial manoeuvre involving BILLIONS?
The truth is, those purchasing the bonds are ACTUALLY indifferent to the rising stock value! Their primary interest lies in capitalizing on price fluctuations. Ultimately, a convertible bond functions as a CALL OPTION; thus, as the MSTR stock price experiences greater volatility, the premium on the call increases. Recently the value of these convertible bonds has surged by 170%. This is precisely why investors are unconcerned about interest rates or the actual conversion of the bonds—they have ZERO desire to convert! The reason? Issuing new shares would only dilute their holdings!
All the rewards with none of the risks!
But what happens if MSTR collapses? Bondholders will seize all the Bitcoin MSTR possesses, leaving shareholders with nothing but scraps!
Can you fathom how deep this MSTR Ponzi scheme really is?
The more you explore, the more mental acrobatics you need to perform to grasp the situation!
Many believe that bond buyers are naive, but in reality, they are the sharpest players in the game, reaping the benefits without facing the risks! In the current climate, that’s the nature of volatility! It doesn’t matter if MSTR’s stock price fluctuates; they’re insulated from the fallout. Who do you think is betting against MSTR? It’s the bondholders, and their positions are secure!
Ultimately, for someone to profit, someone else must incur a loss, and it won’t be the bondholders. This means that regular shareholders are poised for significant losses, as the primary force driving MSTR’s stock price is its own volatility. Once that volatility dissipates, we could see MSTR plummet below $100 a share! All those crypto enthusiasts will be left reeling, wondering how MSTR could possibly decline while Bitcoin’s value rises!!!
What’s the main effect of these convertible bonds?
They create volatility in the stock price, leading to wild swings up and down, just as we’re currently witnessing.
What occurs when the volatility subsides?
The stock price will plummet!
Many people are misdirecting their focus on metrics, technical analysis, and listening to Michael Saylor's commentary on CNBC. Instead, they should be paying attention to the volatility of MSTR's stock price, as its decline will directly impact the stock's value.
Don't be misled; even if MSTR falls below $300, it will still be overpriced and could potentially drop to under $100 per share due to the convertible bonds scheme. Claims from MSTR valuation sites that each share is backed by a certain amount of Bitcoin are misleading; the reality is that the shares are not backed by anything.
The BONDHOLDERS are the ones who possess all the Bitcoin.
There’s no such thing as a free lunch—someone has to bear the costs, and in MSTR's case, that burden will fall on the shareholders. You certainly don’t want to be left holding the bag when the music stops.
It is important to maintain a clear perspective regarding cryptocurrencies; they should not be viewed as traditional investments, but rather as something more comparable to gambling.
While you may have the advantage of being an expert poker player, the only way to truly win is to cash out your profits.
Otherwise, you risk losing on MSTR and in the crypto market.
