Micron Technology - The Textbook Chart!Micron Technology ( NASDAQ:MU ) is retesting massive support:
Click chart above to see the detailed analysis👆🏻
For the past seven year, Micron Technology has been respecting a pretty clear rising channel pattern. With the recent all time high breakout, it is very likely that this level is now holding as support and we will eventually see a rejection and new all time highs.
Levels to watch: $90, $180
Keep your long term vision,
Philip (BasicTrading)
MU trade ideas

Micron (MU) Stock Update: Correction or Collapse?Morning Trading Family
Here's what's up with Micron (MU): If it bounces back at 92, cool. But if it keeps going down, it might hit 89-90 before it stops. If it drops past that, we might see it go to 84 or even 80. This could be a big moment for MU, so keep watching!
Kris/Mindbloome Exchange
Trade What You See

HUGE consolidation area at 95The oscillators are waiting for a breather and a break. This is going to break the mid-90s if the bearish sentiment gets louder. The tech sector, specifically AI, has helped with bullish conditions in the market. Technically, this has more than enough room to continue even lower.

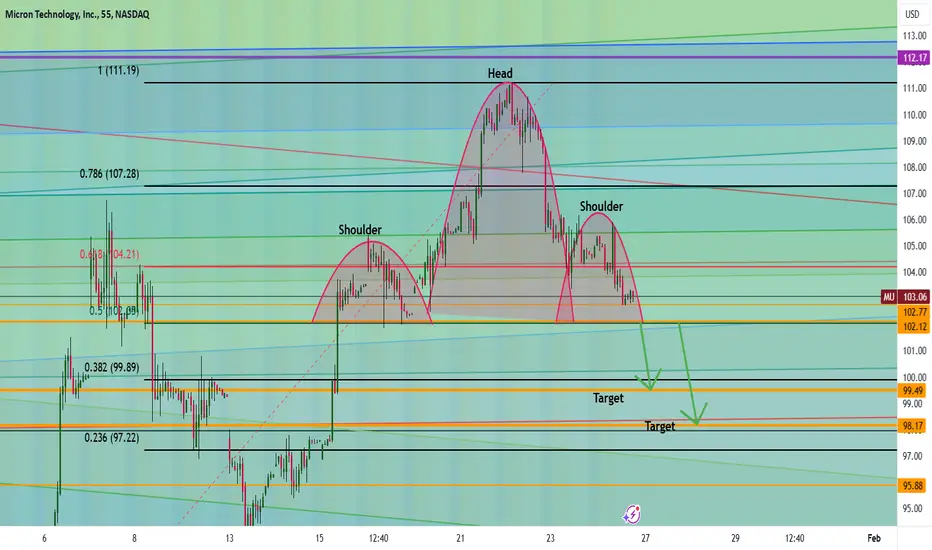
Micron's Next Move: Will $102 Trigger a Drop to $98?Micron (MU) is showing a head and shoulders pattern, and it’s at a critical level. If it breaks below $102, I think we could see it drop to $99.50 or even $98.
This could be a big move, so keep an eye on it!
If this helps, I’d love to hear your thoughts—drop a comment, like, or share. Let’s trade smarter and live better! 💡
Kris/Mindbloome Exchange
Trade What You See
Micron Technology (MU)- Dual Scenarios Emerging from Key LevelsMicron Technology Inc. (NASDAQ: MU) - Navigating Key Levels with Analyst Insights
Micron Technology (MU) is at a pivotal juncture, trading between significant support and resistance levels. While the technical chart suggests dual possibilities for the price movement, analyst projections and ratings further highlight the stock's potential for the coming year.
Chart Analysis: Key Levels to Watch
Support and Resistance:
The support trendline near $87 has proven to be a robust base for Micron.
On the other hand, the resistance zone at $115-$120 marks a key hurdle for any bullish breakout.
Potential Scenarios:
Bullish Case: A breakout above $120 could see the stock targeting $140 and $160, marking a continuation of its broader uptrend.
Bearish Case: Failure to hold the $85 support and the ascending trendline could lead to a retracement toward $70 or lower.
Analyst Insights: 1-Year Forecast
Average Price Target: $132.01 (a potential upside of +47.87% from current levels).
Maximum Estimate: $250 (a whopping +180.02% upside).
Minimum Estimate: $31.66 (a downside risk of -64.54%).
The analyst ratings further reinforce the bullish sentiment:
27 analysts recommend a Strong Buy.
9 analysts suggest a Buy.
Only 1 analyst lists it as a Strong Sell.
This positive outlook aligns with the bullish potential of a breakout above the $120 level.
Trading Plan Based on the Setup
Bullish Setup:
Entry: Above $120 with volume confirmation.
Targets: $114, $120, $140 and $160.
Stop-Loss: Below $85.
Bearish Setup:
Entry: Below $85.
Targets: $70 and $63.
Stop-Loss: Above $87
What’s your outlook for Micron? Will it surge past $120 or retreat toward $70? Share your thoughts below and let’s discuss! 📈🚀
⚠️ Disclaimer: This blog is for informational purposes only and does not constitute financial advice. Always do your research before making investment decisions.


Micron Technology's Journey to the 136 PeakGood morning, trading family! Here's the lowdown on Micron Technology (MU):
Picture MU climbing "136 Peak" with hurdles at $104, $111, and $114. Each is like a mountain bump where we might see a slip or a leap forward. With AI and memory chips in high demand, Micron's equipped for this climb, but expect some corrections like pit stops. Keep an eye on tech trends and the economy; they'll tell us if MU makes it to the top!
If you found this useful: boost, share, like, and comment. I appreciate all the support! If you're struggling as a trader to be sustainable, I get it - I've been there myself. Jump in, send me a DM or head to my profile; I'm more than happy to help.
Kris/Mindbloome Exchange
Trade What You See

MU Tests Key Support! Will the Bulls Hold the Line? Jan. 14
Technical Analysis Overview:
4-Hour Chart:
* Trend: MU is retracing after a sharp rally, consolidating near the $96-$97 level.
* Indicators:
* EMA (9/21): The price is below the 9 EMA, but the 21 EMA is providing nearby dynamic support.
* MACD: Shows bearish momentum, but the histogram is contracting, signaling potential stabilization.
30-Minute Chart:
* Price Action:
* The stock is holding above $96, a key level aligned with immediate GEX resistance.
* $92.5 acts as critical support, highlighted by high PUT support.
* Volume: Lower volume on the pullback suggests a lack of strong selling pressure.
Key Levels to Watch:
Support Levels:
* $92.5: Significant support zone aligned with strong PUT activity (-99.65% GEX).
* $90: Next major support level, close to the 3rd PUT Wall.
Resistance Levels:
* $96-$97: Immediate resistance and highest positive NETGEX level.
* $100: Next resistance, coinciding with the 3rd CALL Wall.
* $106.7-$110: Major resistance aligned with the 2nd CALL Wall.
GEX Insights:
Key Gamma Levels:
* Positive Gamma Walls (Resistance):
* $96-$97: Immediate gamma resistance and the highest positive NETGEX.
* $100: 21.31% GEX (3rd CALL Wall).
* $110: 34.38% GEX (2nd CALL Wall).
* Negative Gamma Levels (Support):
* $92.5: -99.65% PUT support, critical to maintaining bullish structure.
* $90: High PUT activity (-75.97% GEX).
Options Metrics:
* IVR: 29.9, indicating relatively low implied volatility.
* IVx: 49.1, close to average.
* Call/Put Bias: 30.7% Calls, leaning slightly bullish.
Trade Scenarios:
Bullish Scenario:
* Entry: Above $97 with volume confirmation.
* Target: $100-$106.7.
* Stop-Loss: Below $92.5 to limit risk.
Bearish Scenario:
* Entry: Rejection at $97 or a breakdown below $92.5.
* Target: $90-$87.5.
* Stop-Loss: Above $100 to control losses.
Directional Bias:
* MU's recent pullback presents a consolidation phase, with $96-$97 as a critical inflection point. Bulls need a breakout above this zone to retest $100-$106, while bears will likely target $92.5 or lower if support breaks.
Conclusion:
MU is at a decisive level, with $96-$97 serving as immediate resistance. A breakout or rejection here will define the next trend. Traders should keep an eye on gamma resistance and support levels for actionable opportunities.
Disclaimer:
This analysis is for educational purposes only and does not constitute financial advice. Always conduct your research and trade responsibly.

MU ACCUMULATIONLooks Like accumulation into break-out soon or possibly last leg of Accumulation with Final Shake-Out

Micron a bullish thesisHas anyone seen the daily volume candle today for micron?
Makes one think we're at the start of something special.
Tsmc growth report
NVidea
Quantum still a way off
Sofi, palantir, nvidia, Tesla all need a cool.down.
So where do you go?
Especially when Ram is at least 30% of the Ai cake.
When it's all said and done these Companies will be the backbone of the AI infrastructure.
How about to critical components for AI in a stock that has been beaten down?
Goodnight & thankyou 💓

Micron Technology: Bearish or Ready to Break Out?Good morning, trading family!
Micron (MU) is at an important spot right now:
If we move lower, I’m watching $97 and $96 as key levels, with potential for more downside.
If we hold above $100, there’s room to climb to $102, $103, and $104. A break above $104 could mean a smoother ride higher.
I’m also hosting a Master Your Mind Traders Class this Sunday to help you refine your skills and mindset. Want to join? Send me a message for details.
Kris/ Mindbloome Exchange
Trade What You See

Hidden gem, may be worth a looky looNow that Quantum reality is a smoke dream for now, we must look at derivatives of the AI Revolution and I believe RAM is going to be pretty sweet.
No reason this cannot be as exciting.
May see 250, but nothing wrong with 130.
Recent collaboration with Nvidia should pirck some ears.
🙏

Undervalued MU Target: 129
Run: ATH
Trade compound: $85 - $76
Info;
Nestled in the heart of the semiconductor industry, Micron Technology Inc. has carved out a discerning path marked by innovation and resilience. Founded in 1978, Micron has methodically grown its footprint to become a leading producer of memory and storage solutions. It primarily manufactures DRAM, NAND, and NOR memory, vital components in a multitude of digital devices and data centers that fuel the modern economy. These components are essential for everything from personal computing and smartphones to the vast expanses of cloud infrastructure, making Micron an integral player in technological advancement. The company's steady march forward is buoyed by its deep investments in research and development, enabling it to stay at the forefront of industry trends and consumer demands.
The mechanics of Micron's business are predicated on its ability to efficiently produce and distribute these high-precision memory solutions across global markets. The company earns its revenue by providing these components to a diverse array of end markets, including automotive, mobile, and enterprise sectors. This diversity acts as a buffer against volatility in any single market segment, illustrating a strategy that echoes the prudent philosophies of economic moats and competitive advantages. Micron’s operational prowess is also characterized by its strategic partnerships and alliances, which bolster its supply chain and technological capabilities. As data becomes the new oil, Micron's role in supporting advanced computing applications, artificial intelligence, and increasingly data-centric industries places it on a promising trajectory in the digital age.
Micron Technology Inc. maintains several unique competitive advantages that distinguish it from its rivals in the semiconductor industry:
Intellectual Property and Technological Innovation: Micron is known for its strong portfolio of patents and consistent innovation in memory and storage solutions. They have a robust R&D program that allows them to frequently bring advanced technologies to market.
Vertical Integration: Micron benefits from vertical integration, allowing them to control various stages of production, from design to manufacturing. This integration helps optimize costs, enhance quality control, and ensure a steady supply of key components.
Product Portfolio Diversity: Micron offers a diverse range of products, including DRAM, NAND, and NOR memory technologies. This variety helps cater to different market needs and provides resilience against market fluctuations in specific product lines.
Advanced Manufacturing Facilities: Micron has state-of-the-art manufacturing facilities often coupled with strategic partnerships, which enable them to produce cutting-edge technology efficiently. This also facilitates rapid scaling of production to meet demand.
Strategic Partnerships and Collaborations: Through alliances with other technology companies and research institutions, Micron accelerates innovation and gains access to new technologies and markets. These collaborations can provide competitive access to emerging trends and pathways.
Strong Customer Relationships: With extensive experience and expertise, Micron has built strong relationships with leading technology firms across various sectors such as consumer electronics, automotive, data centers, and mobile devices. These partnerships provide stable revenue streams and insights into market needs.
Fundamentals:
The intrinsic value of one MU stock under the Base Case scenario is 129.52 USD. Compared to the current market price of 86.36 USD, Micron Technology Inc is Undervalued by 33%.
Wall Street Target: $133.61
Estimates Growth: 23% in 2025
Operating Income Forcase: From 1B to 12B in 2025
Net Income: 2025 estimated 10B
Solvency Score: 70/100
Current shareholder yield for MU is -1.02%.
During the last 12 months Micron Technology Inc insiders have not bought any shares, and sold 46m USD worth of shares. The last transaction was made on Dec 20, 2024 by Arnzen April S , who sold 416.7k USD worth of MU shares.
Technicals:
Weekly: Overall negative (short-term positive)
Daily: Strongly positive
4h: slightly positive
30min: Bullish

Micron Technology, Inc. (MU): Testing Key Resistance Amid Bullis🔥 LucanInvestor’s Strategy:
🩸 Long: Above $101.36, targeting $106 and $110. Sustained buying volume required to confirm breakout.
🩸 Short: Below $93.57, aiming for $90 and $85. Weak momentum may accelerate declines.
🔥 LucanInvestor’s Commands:
🩸 Resistance: $101.36. A breakout could signal further bullish movement towards $106.
🩸 Support: $93.57. A breakdown may test $90, risking a bearish reversal.
Micron has seen a resurgence in bullish activity, with MACD crossing into positive territory. However, the upcoming sessions depend heavily on sustained volume and a clear breakout of resistance levels.
👑 "True strategy emerges when uncertainty reigns supreme." — LucanInvestor

MU give it to me.I will add below 90 any day. I am curious why there was such aggressive selling on MU even in a soft environment for semis.

MICRON. Down to 49 ot 50 then ATH 654Micron. My latest update after a deep to 49 or 50 hopefully not lower, an ath high of 654 will happen. It may take a while but its coming. KINGS IDEAS.

Micron Technology - The perfect chart!NASDAQ:MU is one of these stocks, which just respects every level, cycle and structure.
If I would give each chart an individual rating, the chart of Micron Technology would be 10 out of 10. Micron Technology is actually respecting every structure level and providing textbook trading opportunities. If we get a retest of the previous all time high, which is now turned support and perfectly lining up with the support of the rising channel, I will certainly look for longs.
Levels to watch: $90
Keep your long term vision,
Philip - BasicTrading

71-78 area looks good for a reset and consolidate here 100This has been a good stock fundamentally, and catalyst is not often giving it the credit it deserves; I am closely monitoring a reversal, but oscillators are not sold on the idea of not curving as quickly, 4th time it has hit the support line could break this area into the 70s region before we find a solid area of buying pressure also volume is high between the gap that needs to fill from 90-103 this is our target area. Already oversold, continue to wait for confirmation. Do foresee the moving averages crossing over at some point.

Target price 49The Bearish pattern is sitting at the bottom of the second leg at 88. It will deep lower to 49 in the next several weeks at least by Jan 30Th 2025.

Micron Technology (MU): Is a Big Move Just Around the Corner?Good morning, trading family!
Micron’s price has been moving between $92.90 resistance and $84.26 support, and it looks like a big move could be coming soon. Will we see a breakout to higher levels, or a pullback to retest support?
This is one of those setups where being patient and watching how the price reacts at these levels can really pay off. Stay ready, and let’s tackle this opportunity together!
Comment, like, follow, or send me a DM if you want a deeper analysis or more insights!
Kris/Mindbloome Exchange
Trade What You See

MU potential bounce off triple bottom.Semiconductors have been beaten down the last few months. MU is no exception. Look for a potential bounce off the triple bottom. Potential of 20% - 30% gain. Set tight S/L just below triple bottom. Keep a close eye next week 12/23 - 12/27.

Micron ($MU) is Poised for Action – Here’s What’s ComingMicron is sitting at a major decision point, and the next move could be big. Here’s the game plan:
If we drop below $84: Things could get bumpy, with possible corrections to $74, $70, or even $63–$64.
If we break above $93: The sky’s the limit, with targets at $100, $110, and maybe even $138 on the horizon.
This is one to watch closely. Big moves are coming, so stay sharp and ready to ride the wave!
Kris/Mindbloome Exchange
Trade What You See
