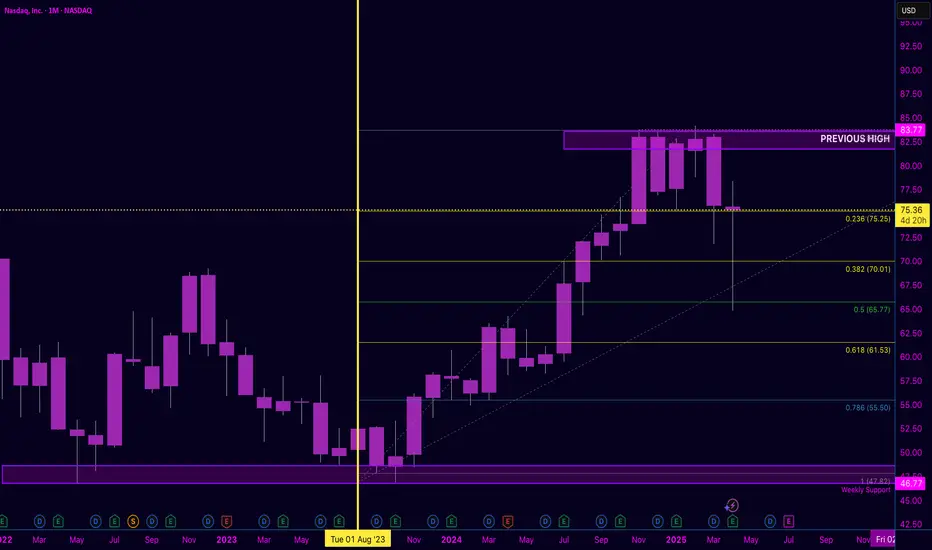
NASDAQ Monthly | Healthy Correction or Trend Shift?
Price has pulled back from the $83.77 previous high, now hovering right on the 0.236 Fib level at $75.25 — a critical area to watch.
🟣 Rejection at the top shows momentum cooling. 🟡 If support fails here, eyes shift to $70.01 (0.382) and possibly $65.77 (0.5) as next key levels.
This move may be

Nasdaq Ready to Fall==>-5%_-10%The Nasdaq Index started to rise with the help of the " Long Island " upward continuation pattern and made the New All-Time High(ATH) .
The Nasdaq Index is currently near the upper line of the Ascending Channel and has succeeded in breaking the Uptrend line .
Also, Regular Divergence (R

Nasdaq & RTX Charts Suggest Promising Growth AheadNASDAQ
After a powerful uptrend, the stock encountered a significant resistance around the 72 level and plummeted sharply thereafter.
Finding stability near the 47 level, the price surged within a Rising Wedge formation.
Typically, following the appearance of this pattern, a decline occurs pos

NASDAQ HTF SWING IS BULLISH NASDAQ UPDATE
-Heavily bullish
-Expect a pullback after BOS, currently price in between swing points( no mans land)
-Use H4 to confirm bearish OF to Sell entry opportunities

The Nasdaq reaches a critical resistance and could reverse.The Nasdaq is forming a falling triangle pattern. It has been in an uptrend since October 2023, as have the stocks that comprise the Nasdaq. At the moment, it is approaching the resistance line on the upside and could get rejected. What does this mean for the other stocks?
- On the 3-line indicat

NDAQ Retesting Significant TrendlineNDAQ has formed a clear descending triangle. Statistically more likely to see a breakdown, but not an extremely reliable pattern. The flat bottom changes the pattern from a bullish pattern to a more bearish one.
Breakout, with potential to retest ATHs? Or another retrace to recent lows, i.e. bottom

Nasdaq Possible MoveYou are correct, the Nasdaq is an index, not a stock. Here is an improved version of the sentence:
The Nasdaq index is currently trending within a bullish channel, indicating a positive outlook. I anticipate further price increases based on the chart analysis.

NDAQ - Make or Break SpotNDAQ Consolidating and is looking like it's in quite the make-or-break spot. Definitely will be keeping an eye on the Nasdaq and broader markets, the NDAQ has a double bottom off of the lower trendline, while simultaneously all other signs point bearish. Death cross on both the MACD as well as the 5

NASDAQ Bullish Wolf PatternNASDAQ Appears to be forming an overall bullish Wolf Pattern on the Weekly, which aligns with down Q1 & Q2, and then up.

See all ideas
Displays a symbol's price movements over previous years to identify recurring trends.
Curated watchlists where NDAQ is featured.

