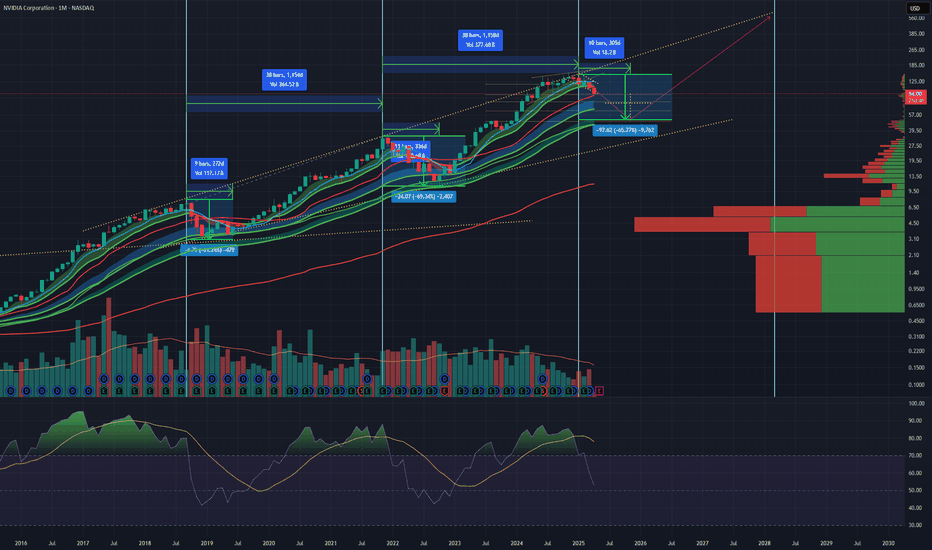
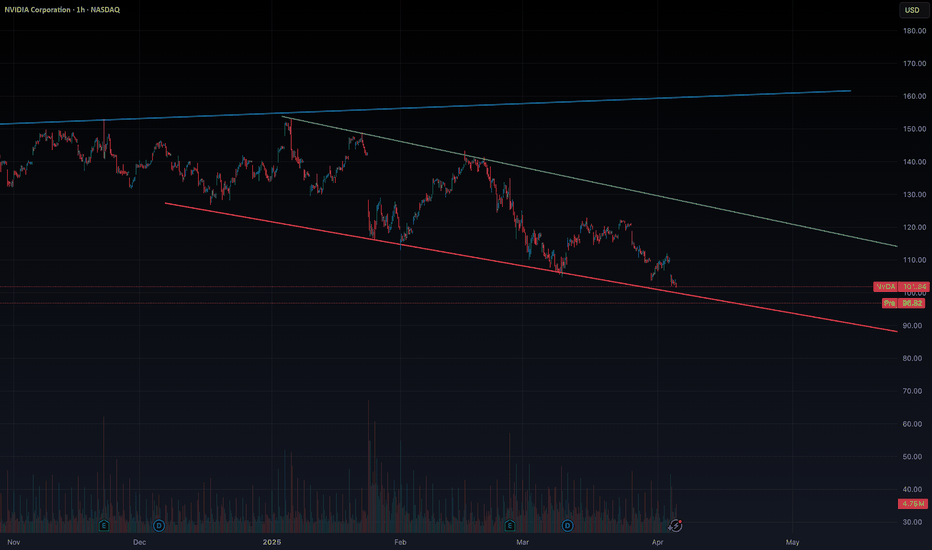
NVDA short: Wave count updateFollowing my previous NVDA call, here is the updated wave count.Shortby yuchaosng116
We can extend into the Target Box, But below $128.73 = $95 BucksNvidia has arrived in the target box for our intermediate (B) wave high. Can we extend in the target box? Yes. However, two things are top of mind to this analyst. 1) The earnings catalyst mid-November is a "keep hope alive event". Therefore, I do not see big trader commitments prior to that. If we go up further into the target box...it will be an overlapping grinding pattern. I see the earnings catalyst as positive fundamentally, but a technical sell event. 2) If price breaches $128.74...that should yield us $95. If this is how the price action plays out...then at $95, you would do well consider NVDA longs. Best to all, Chrisby maikisch5544
The best entry pointOne of the best ways to find suitable entry points is to use the Cumulative volume delta indicator, the lowest points of which can be used as the lowest price level in different time periods, draw a horizontal line at the lowest part and trade Use right in the market You can use this indicator as a tool along with your strategy, definitely no indicator has 100% accuracy and sensitivity. Sasha CharkhchianEducationby sashacharkhchian6
NvdaHeaded into AMD earnings next week. Price is showing a rising wedge here at ATH and is also overbought. Now the technicals provide a condition for a bear short but you still need a catalyst, and I'm thinking AMD earnings maybe that catalyst My target price is 127 gap close or 130 area but Nvda could bounce at 135 are because of 20sma and 133 gap close Shortby ContraryTrader1119
NVDA Nvidia Let's take a quick look at NASDAQ:NVDA H&S Head and Shoulders Pattern Forming Look for volume surge if the price closes below the neckline Volume has already been declining after rising through the first two peaks. This is based on a short term 30 minute chart and not financial advice.by Paul_Hodls3
UPSIDE TARGETS for NVIDIA #NVDA ...As you can see Nvidia has already triggered a Hunt Volatility Funnel pattern #HVF Target 1 has already been made ($134.93) Target 2 is in progress coming in at $157.93 Target 3 is at $188.98 With the US election uncertainty almost out of the way. WallSt can then get behind a Santa rally. Don't be surprised if you see Nvidia get close to (buy probably not reach) $200 $188.98 gives Nvidia a $4.6T marketcap @TheCryptoSniper Longby BallaJi7
BIG POST! | How To Beat SP500? S&P 500 Performance: +35% since 2022. My Selected Portfolio Performance: +62%, with an 82% hit rate. Top Performing Stocks: NVDA (+735%), ANET (+343%), META (+209%), and more. Technical Analysis Tools Used: Price action, trendlines, Fibonacci levels, round numbers, and more. It’s been nearly three years since I posted my analysis of S&P 500 stocks on February 23, 2022. Back then, I reviewed all 500 stocks, applied some quick technical analysis, and identified 75 stocks that stood out for me. Importantly, I relied solely on technical analysis to make my picks. Fast forward to today, and the results speak for themselves. Most of these selections have significantly outperformed the broader market, proving the power and importance of technical analysis. While many investors rely solely on fundamentals, technical analysis brings a dynamic edge that’s often underestimated. By focusing on price action and market behavior, technical analysis allows us to spot opportunities that others might miss, especially it gives a massive psychological edge while the markets are making corrections. The market doesn't care what you know, the market cares what you do! Here’s what I used for my analysis: It's kind of pure price action - previous yearly highs, trendlines, a 50% retracement from the top, round numbers, Fibonacci levels, equal waves, and channel projections. For breakout trades, determined strong and waited for confirmation before pulling the trigger. The Results While the S&P 500 has gained around 35% over this period , my selected stocks from the same list have made +62%! Out of the 75 stocks I picked, 67 have hit my target zones and 54 are currently in the green. That’s an 82% hit rate, and for me, that’s a good number! Now, for those who favor fundamental analysis, don’t get me wrong, it has its place. But remember, fundamentals tell you what to buy, while technicals tell you when to buy - to be a perfect investor, you need them both. You could hold a fundamentally strong stock for years, waiting for it to catch up to its "true value," while a technical analyst might ride multiple trends and capture far superior returns during that same time. Also, the opposite can happen – you may see a great technical setup, but if the fundamental factors are against it, you could end up with your money stuck in a bad trade. To put these ideas in perspective, starting with a simulated portfolio of $76,000, where each stock had an equal investment of around $1,000–$1,100, the portfolio is now worth around $124,000. The results are based on buying at marked zones and holding until today. I calculated entries from the middle of the target zone, as it’s a more realistic and optimal approach compared to aiming for perfect lows (which, frankly, feels a bit scammy) to get much(!) higher returns. This method reflects real-world trading. Before we dive in, here are the current Top 5 stocks from My Picks: NVDA: +735% ANET: +343% TT: +227% META: +209% LEN: +164% These numbers demonstrate the effectiveness of a solid technical strategy. Many say it's tough to beat the market with individual stock picks, but these results show it’s not just possible, it’s absolutely achievable with the right tools and approach. Now, let's dive into the charts! 1. Apple (AAPL) - a load-it-up type of setup has worked out nicely. Used previously worked resistance levels. If the stocks performing well and the market cap is big enough then these levels can help you to get on board. Current profit 65% Before: After: --------------------------- 2. Adobe (ADBE) - came down sharply, but the price reached the optimal area and reversed. Current profi 38%. Before: After: --------------------------- 3. Advanced Micro Devices (AMD) - round number, strong resistance level becomes support and the climb can continue. Current profit 101% Before: After: --------------------------- 4. Amazon (AMZN) - came down from high prices to the marked levels and those who were patient enough got rewarded nicely. Current profit 66% Before: After: --------------------------- 5. Arista Networks (ANET) - retest of the round nr. worked perfectly, as a momentum price level, after the strong breakout. Current profit 343% Before: After: --------------------------- 6. Aptiv PLC (APTV): Came down quite sharply and it will take some time to start growing from here, if at all. The setup was quite solid but probably fundamentals got weaker after the all-time high. Current loss -24% Before: After: --------------------------- 7. American Express (AXP) - firstly the round nr. 200 worked as a strong resistance level. Another example is to avoid buying if the stock price approaches bigger round numbers the first time. Came to a previous resistance level and rejection from there… Current profit 104% Before: After: --------------------------- 8. Bio-Rad Laboratories (BIO) - in general I like the price action, kind of smoothly to the optimal zone. It might take some time to start growing from here but also fundamentals need to look over. Current loss 6% Before: After: --------------------------- 9. BlackRock (BLK) - kind of flawless. All criteria are in place and worked perfectly. Current profit 81% Before: After: --------------------------- 10. Ball Corporation (BALL) - a perfect example of why you should wait for a breakout to get a confirmed move. No trade. Before: After: --------------------------- 11) Berkshire Hathaway (BRK.B) - Buy the dip. Again, as Apple, a big and well-known company - all you need to do is to determine the round numbers, and small previous resistances that act as support levels, and you should be good. Current avg. profit from two purchases 64% Before: After: --------------------------- 12) Cardinal Health (CAH) - the retest isn't as deep as wanted but still a confirmed breakout and rally afterward. Still, the bias was correct! Before: After:https://www.tradingview.com/x/83OmlWuv/ --------------------------- 13) Ceridian HCM Holding (DAY) - found support from the shown area but not much momentum. Current profit 20% Before: After: --------------------------- 14) Charter Communications (CHTR) - technically speaking it is a quite good price action but kind of slow momentum from the shown area. Probably came too sharply and did not have enough previous yearly highs to support the fall. Current loss -10% Before: After: --------------------------- 15) Comcast Corp. (CMCSA) - got liquidity from new lows, pumped up quickly, and is currently fairly solid. Current profit 10% Before: After: --------------------------- 16) Cummins (CMI) - got rejected from 2028 and 2019 clear highs, fairly hot stock, and off it goes. Current profit 80% Before: After: --------------------------- 17) Salesforce.com (CRM) - perfect. 50% drop, strong horizontal area, and mid-round nr did the work. Current profit 83% Before: After: --------------------------- 18) Cisco Systems (CSCO) - worked and slow grind upwards can continue. Current profit 30% Before: After: --------------------------- 19) Caesars Entertainment (CZR) - not in good shape imo. It has taken too much time and the majority of that is sideways movement. Again, came too sharply to the optimal entry area. Current loss -16% Before: After: --------------------------- 20) Devon Energy (DVN) - inside the area and actually active atm. Still, now I’m seeing a bit deeper correction than shown. Before: After: --------------------------- 21) Electric Arts (EA) - 6 years of failed attempts to get a monthly close above $150 have ended here. It got it and we are ready to ride with it to the higher levels. Current profit: kind of BE Before: After: --------------------------- 22) eBay (EBAY) - it took some time but again, worked nicely. Before: After: --------------------------- 23) Enphase Energy (ENPH) - got a breakout, got a retest, and did a ~76% rally after that! If you still hold it, as I do statistics, then… Current loss -59% Before: After: --------------------------- 24) Expeditors International of Washington (EXPD) - kind of worked but didn't reach. No trade. Before: After: --------------------------- 25) Meta Platforms (META) - the bottom rejection from the round number $100 is like a goddamn textbook :D At that time 160 and 200 were also a good area to enter. Here are several examples of the sharp falls/drops/declines - watch out for that, everything should come fairly smoothly. Still, it ended up nicely and we have a massive winner here... Current profit 209% Before: After: --------------------------- 26) FedEx (FDX) - I love the outcome of this. Very solid price action and multiple criteria worked as they should. Perfect. Current profit 60% Before: After: --------------------------- 27) First Republic Bank (FRC) - firstly got a solid 30 to 35% gain from the shown area but...we cannot fight with the fundamentals. Current loss 99% Before: After: --------------------------- 28) General Motors (GM) - finally found some liquidity between strong areas and we are moving up. Current profit 47% Before: After: --------------------------- 29) Alphabet (GOOG) - load it up 3.0, a good and strong company, and use every previous historical resistance level to jump in. Current avg. profit after three different price level purchases 63% Before: After: --------------------------- 30) Genuine Parts (GPC) - coming and it looks solid. Before: After: --------------------------- 31) Goldman Sachs (GS) - really close one. Current profit 86% Before: After: --------------------------- 32) Hormel Foods (HRL) - quite bad performance here. Two trades, two losses. The current loss combined these two together is 35% Before: After: --------------------------- 33) Intel (INTC) - at first perfect area from where it found liquidity, peaked at 65%. Still, I make statistics if you still holding it then… Current loss -21% Before: After: --------------------------- 34) Ingersoll Rand (IR) - beautiful! Current profit 144% Before: After: --------------------------- 35) Intuitive Surgical (ISRG) - the trendline, 50% drop, strong horizontal area. Ready, set, go! Current profit 157% Before: After: --------------------------- 36) Johnson Controls International (JCI) - second rest of the area and then it started to move finally.. Current profit 55% Before: After: --------------------------- 37) Johnson & Johnson (JNJ) - Buy the dip and we had only one dip :) Current profit 13% Before: After: --------------------------- 38) CarMax (KMX) - the area is strong but not enough momentum in it so I take it as a weakness. Current profit kind of BE Before: After: --------------------------- 39) Kroger Company (KR) - without that peak it is like walking on my lines Current profit 15% Before: After: --------------------------- 40) Lennar Corp. (LEN) - strong resistance level becomes strong support. Beautiful! Current profit 164% Before: After: --------------------------- 41) LKQ Corp. (LKQ) - just reached and it should be solid. Probably takes some time, not the strongest setup but still valid I would say. Before: After: --------------------------- 42) Southwest Airlines (LUV) - no breakout = no trade! Don’t cheat! Your money can be stuck forever but in the meantime, other stocks are flying as you also see in this post. If there is a solid resistance, wait for the breakout and possibly retest afterward! Currently only lower lows and lower highs. Before: After: --------------------------- 43) Las Vegas Sands (LVS) - channel inside a channel projection ;) TA its own goodness! Current profit 70% Before: After: --------------------------- 44) Microchip Technology Incorporated (MCHP) - worked! Current profit 37% Before: After: --------------------------- 45) Altria Group (MO) - got a bit deeper retest, liquidity from lower areas, and probably a second try.. Currently kind of BE Before: After: --------------------------- 46) Moderna (MRNA) - "seasonal stocks", again too sharp and we are at a loss… Current loss -37% Before: After: --------------------------- 47) Morgan Stanley (MS) - the first stop has worked, and got some nice movements. Current profit 62% Before: After: --------------------------- 48) Microsoft (MSFT) - Load it up 4.0, buy the dip has worked again with well-known stock. Three purchases and avg. return from these are amazing 70% Before: After: --------------------------- 49) Match Group (MTCH) - it happens.. Current loss -53% Before: After: --------------------------- 50) Netflix (NFLX) - almost the same as Meta. Came quite sharply but the recovery has been also quick. Another proof is that technical analysis should give you a psychological advantage to buy these big stocks on deep corrections. Current profit 153% Before: After: --------------------------- 51) NRG Energy (NRG) - Perfect weekly close, perfect retest… Current profit 90% Before: After: --------------------------- 52) NVIDIA (NVDA) lol - let this speak for itself! Current profit 735% Before: After: --------------------------- 53) NXP Semiconductors (NXPI) - usually the sweet spot stays in the middle of the box, and also as I look over these ideas quite a few have started to climb from the first half of the box. Touched the previous highs. Current profit 74% Before: After: --------------------------- 54) Pfizer (PFE) - actually quite ugly, TA is not the strongest. Probably results-oriented but yeah.. Current loss -25% Before: After: --------------------------- 55) PerkinElmer - “after” is EUR chart but you get the point. Current profit 25% Before: After: --------------------------- 56) Pentair (PNR) - worked correctly, 50% drop combined with the horizontal area, easily recognizable, and the results speak for themselves. Current profit 124% Before: After: --------------------------- 57) Public Storage (PSA) - again, previous yearly highs and the trendline did the job. Current profit 36% Before: After: --------------------------- 58) PayPal (PYPL) - the area just lowers the speed of dropping, but slowly has started to recover. Current loss -14% Before: After: --------------------------- 59) Qorvo (QRVO) - slow, no momentum. Current profit 10% Before: After: --------------------------- 60) Rockwell Automation (ROK) - previous yearly high again, plus some confluence factors. Current profit 32% Before: After: --------------------------- 61) Rollins (ROL) - after posting it didn’t come to retest the shown area. Being late for a couple of weeks. Worked but cannot count it in, the only thing I can count is that my bias was correct ;) Before: After: --------------------------- 62) Snap-On Incorporated (SNA) - same story! Before: After: --------------------------- 63) Seagate Technology (STX) - firstly it came there! Look how far it was, the technical levels are like magnets, the price needs to find some liquidity for further growth and these areas can offer it. I like this a lot, almost all the criteria are in place there. Current profit 73% Before: After: --------------------------- 64) Skyworks Solutions (SWKS) - one of the textbook examples of how trendline, 50% drop, round nr. and strong horizontal price zone should match. Still a bit slow and it will decrease the changes a bit. Kind of BE Before: After: --------------------------- 65) TE Connectivity (TEL) - came down, and got a rejection. “Simple” as that. Current profit 37% Before: After: --------------------------- 66) Thermo Fisher Scientific (TMO) - mister Ranging Market. Current profit 19% Before: After: --------------------------- 67) Trimble (TRMB) - finally has started to move a bit. Got liquidity from previous highs again and.. Current profit 45% Before: After: --------------------------- 68) Tesla (TSLA) - made a split. Have been successfully recommended many times after that here and there but two years ago we traded in these price levels and.. Current profit 19% Before: After: --------------------------- 69) Train Technologies (TT) - dipped the box and off it goes! Epic! Current profit 227% Before: After: --------------------------- 70) Take-Two Interactive Software (TTWO) - I like this analysis a lot. Worked as a clockwork. Current profit 60% Before: After: --------------------------- 71) United Rentals (URI) - WHYY you didn’t reach there :D Cannot count it. Before: After: --------------------------- 72) Waters Corp. (WAT) - came to the box as it should be slow and steady. As the plane came to the runway. Current profit 41% Before: After: --------------------------- 73) Exxon Mobil Corp. (XOM) - another escaped winner. Didn’t come down to retest my retest area so, missed it. Before: After: --------------------------- 74) Xylem (XYL) - perfect trendline, good previous highs, 50% drop from the peak and.. Current profit 76% Before: After: --------------------------- 75) Autodesk (ADSK) - took a bit of time to start climbing but everything looks perfect. Nice trendline, 50% drop from ATH, previous yearly highs - quite clean! Current profit 66% Before: After: The strategies above show how useful price action, key levels, and psychology can be for investing. By spotting breakouts, and pullbacks, or focusing on round numbers and past highs, technical analysis helps give traders an edge in understanding the market. Regards, Vaido Educationby VaidoVeek11
NVDA Technical Analysis for Oct. 25, 2024Technical Analysis Support Levels: $137.47: This is a key support level as shown by the horizontal red line. It represents an area where the price may find buying interest if NVDA starts to fall. $136.37: A lower support level that NVDA tested earlier. If the stock breaks below $137.47, this could act as the next area of demand. Resistance Levels: $141.88: This level represents a previous high that NVDA needs to break to continue its upward momentum. $144.47-$144.50: This higher zone acts as a more significant resistance level where selling pressure may emerge based on prior price action. Trendlines: NVDA appears to be in a short-term downward trend, as indicated by the descending trendline from recent highs. It is testing the trendline now, and a breakout above it may signal a reversal in momentum. Volume: There’s a noticeable uptick in volume, which suggests increased interest as the stock approaches key levels. Higher volume near resistance could indicate a breakout if buyers overpower sellers. MACD: The MACD indicator appears neutral to slightly bearish, with signs of consolidation. No strong divergence or momentum signal is apparent. Tomorrow's Outlook Bullish Case: A breakout above the trendline and resistance at $141.88 could take NVDA to test the higher levels at $144.47-$144.50. Buyers stepping in on higher volume will support this move, and the broader tech sector's sentiment will play a role in further continuation. Bearish Case: If NVDA rejects from the current levels and fails to hold above $137.47, it could drop further, testing the $136.37 support level or even lower. This scenario would be more likely if the stock continues to face pressure from sellers at the trendline. Disclaimer This analysis is for educational purposes only and should not be considered as financial advice. Always conduct your own research or consult a financial advisor before making trading decisions, as trading involves risk.by BullBear-Insights6
Chart Pattern Analysis Of NVDA Once again, the supply or demand pressure dropped to the lowest level at K4. The following candles will choose to break up or fall down. If the following candles successfully retest the support, It will be a good place to buy it there. If the following candle break up K2 immediately, It is also valuable to buy it there. Buy-134.88/Stop-133.6/Target-155 Buy-144.5/Stop-143.1/Target-155by nothingchangehere2
NVIDIA on a strong uptrendNVIDIA Corporation has been showing signs of strength in recent trading sessions, as the stock continues its upward trajectory. Currently trading at around $139.85, the stock is building on a solid base, with multiple indicators suggesting that the bullish momentum may continue. 1. Bullish Breakout and Trendline Support: NVDA recently broke out of a downtrend, surpassing a key descending trendline with strong volume. This breakout suggests a shift in momentum, with the price now trading comfortably above previous resistance levels. A rising trendline is evident, acting as strong support for the stock. As long as this upward trendline holds, the technical outlook remains bullish. 2. Moving Averages Supporting the Uptrend: The stock is currently above the 20-day, 50-day, and 100-day EMAs, which are all pointing upwards. This alignment, with shorter-term EMAs above longer-term ones, indicates a solid upward trend. The 20-day EMA, currently around $133.23, has been acting as a dynamic support level, suggesting that buyers are stepping in at pullbacks. 3. Fibonacci Levels Highlight Key Targets: The stock has broken through key Fibonacci levels, with a target at the 0.786 retracement around $136.14 already surpassed. This indicates that NVDA has the potential to challenge the 1.0 Fibonacci extension level at $143.40. The Fibonacci support levels below suggest a solid base around $125.35, providing a cushion in case of any short-term pullbacks. 4. Volume and Momentum Indicators: Trading volume has shown healthy levels during recent upward movements, suggesting that the rally is backed by strong buying interest. The MACD indicator shows a positive crossover, with the MACD line above the signal line, indicating bullish momentum. RSI is currently at 65.48, below the overbought threshold, suggesting there's room for further upward movement without immediate risk of a pullback. 5. Pivot Points and Price Action: NVDA is trading close to its R1 pivot level of $132.42, which it recently surpassed. If the stock continues its positive trajectory, the next resistance levels to watch are around $143.40 and beyond. Support levels around $125.35 and $116.69 provide a safety net for any minor corrections, ensuring that the broader trend remains intact. NVIDIA Corporation's technical indicators point to sustained bullish momentum, with strong support levels and a clear upward trendline. As long as the stock remains above its key moving averages and trendline, there's potential for it to test higher resistance levels, making NVDA an attractive opportunity for investors looking for further gains in the semiconductor sector.Longby kgougakis9
Exploring Nvidia's India Strategy: AI and LanguageNvidia, a leading technology company, has solidified its commitment to India with a series of significant announcements. The company unveiled a Hindi language model and forged strategic partnerships with major Indian corporations, underscoring its ambition to drive AI innovation and language technology in the country. One of the most notable partnerships announced by Nvidia is with Reliance Industries, led by billionaire Mukesh Ambani. The two companies have outlined plans to build AI infrastructure in India, leveraging Nvidia's cutting-edge hardware and software solutions. This collaboration aims to accelerate AI research, development, and deployment across various sectors, including healthcare, agriculture, and education. In addition to the partnership with Reliance, Nvidia also launched Nemotron-4-Mini-Hindi 4B, a small language model specifically designed for the Hindi language. Hindi, as the most widely spoken language in India, holds immense cultural and economic significance. The availability of a powerful Hindi language model will enable developers to create innovative applications and services tailored to the needs of Hindi-speaking users. Nvidia's investment in India comes at a time when the country is experiencing a surge in AI adoption and development. The government's initiatives to promote digital transformation and innovation have created a favorable environment for technology companies to thrive. By partnering with leading Indian firms and investing in language technology, Nvidia is positioning itself as a key player in India's AI ecosystem. The launch of the Hindi language model is a significant step towards bridging the language gap in AI. While English has dominated the AI landscape, there is a growing recognition of the importance of developing language models for regional languages. By investing in Hindi, Nvidia is demonstrating its commitment to making AI accessible to a wider audience and empowering local communities. Beyond the immediate benefits of language technology, Nvidia's India strategy also has broader implications. By fostering partnerships and investing in AI infrastructure, the company is contributing to the development of a skilled workforce and promoting innovation in the country. This could have a long-term impact on India's economic growth and competitiveness on the global stage. In conclusion, Nvidia's announcement of a Hindi language model and partnerships with major Indian companies marks a significant milestone in its India strategy. By investing in AI and language technology, the company is positioning itself as a key player in the country's digital transformation. As India continues to embrace AI, Nvidia's commitment to the region is likely to yield substantial benefits for both the company and the nation. by bryandowningqln1
NVDA Full Wave Analysis from Weekly to Four HourGood morning Trading Family Here is a massive detailed video outlining my thought process using wave counting and some other tools to figure out where NVDA is going and why along with key levels to look for and some scenarios that we can see play out with NVDA Goal Here is to get you to see how using wave counting can help you form a a structure with your ideas using the IF Then methodology to become a better trader. If this video helped boost, like , share: I am very grateful and appreciate your time watching this video Any questions let me know and send me a Dm if you like Mindbloome Trading Trade What You See Long20:00by Mindbloome-Trading4
NVDA: Buy ideaOn NVDA as you can see on the chart we would have a hight probability to have an uptrend because we have the breakout with force the resistance line.Longby PAZINI1911
NVDANVDA is in a multiday uptrend channel and at the bottom of a 30 min rising channel. I foresee move up in the range of 10 - 12 USD of current price levels. I bought at 140 per share with TP slightly below of an important psychological level of 150. If this is taken out, we could see sharp move up but I don't expect that to happen soon. Longby Aitvaras0077
NVDA Technical Analysis for Oct. 24,2024Resistance Levels: 144.50 - 144.45: This zone represents immediate resistance for NVDA. Watch for any break above this level with strong volume to confirm a potential move higher. If NVDA cannot break this level, it may signal a possible reversal. 146.00: A higher resistance point, which if broken, could signal a bullish continuation, offering potential upside targets toward 150.00. Support Levels: 140.20 - 141.82: This is a significant support zone, acting as a floor for NVDA's current price. If the stock finds support here, it could provide a strong bounce opportunity. Failure to hold 140.20 could result in further downside movement. 136.27: This lower support level could serve as a target in case of a bearish breakdown. A drop below this level could signal significant selling pressure. Trendline: The rising wedge pattern seen earlier has broken to the downside, indicating a bearish signal. This suggests that further downside pressure could be in play if NVDA fails to reclaim key resistance levels. The stock appears to be in a short-term downtrend, but a bounce from support could trigger a reversal. Volume and Momentum: The increase in volume on the recent downtrend suggests that sellers have been in control, but the volume has decreased slightly as the price approaches key support. Momentum indicators are mixed, showing that a break of resistance or support could determine the next direction. My Thoughts for Tomorrow’s Trading: For scalpers, watch for price action around the 141.82 - 140.20 support zone. If the price holds here, you may see a bounce back toward 144.50. For swing traders, a break below 140.20 could trigger a move toward 136.27 and below. Consider going short if this breakdown occurs. On the other hand, a sustained move above 144.50 could trigger a potential long position targeting 146.00 and higher. Stay cautious for false breakouts and monitor volume for confirmation of directional moves. Disclaimer: This analysis is for educational purposes only and should not be considered financial advice. Always perform your own research and use proper risk management when trading. Trading involves significant risk, and past performance is not indicative of future results.by BullBear-Insights6
NVDA is ready to push much higherStudy the price action on this logarithmic daily chart. The thoughtful and observant student will be able to deduce how the magenta channel was constructed. Imo, this channel represents the current probable path of price. Study will certainly reveal existing time cycles. Imo, the next daily cycle top is due in late November-early December. The recent break to new highs has setup a potential year long Bear AB=CD harmonic pattern @ 192.22. As insane as it may sound, I believe that a post-earnings push to +220 by early December is in the cards. Thankfully, I don't have to hope and pray to trade this in a profitable manner. Trade Idea: Believe that history is repeating itself in a fractal manner, buy long, follow the probable path of price, take profit @ 192.22 and/or liquidate if a daily candle closes below the path. I could be could be completely wrong, but, barring immediate gap moves down, I will only suffer a small loss. Otherwise, the probable path of price will allow me to trend follow; accepting what the market gives free of stress and second-guessing. Good luck to all the bulls!Longby moleman3408
Focus on demand in semiconductors, NVDA leading the way.While there are minor disputes among smaller semiconductor firms, the real focus should be on demand. NVDA is making tremendous strides in the data center space. My long-term target is around $171, but in the short term, we need a weekly close above $140.76 for confirmation. I'm a buyer near $141, with $136.15 standing out as the most attractive entry point in the support zone. Falling below this level could lead to short-term frustration.Longby Tolgaun66
NVDA Weekly to Four Hour In Depth Analysis Where Are We Going Good evening Traders So in this video I go into the weekly and down to the four hour and 30 minute identifying key levels to look out for and where the market is going. Currently where we are I really thought we were going to have a shorter correction and punch back up but hey I dont assume and I only trade what the market gives me. What is currently happening is if we can break and close above 140.65 to me that would be a great entry for this bull run up to 150's However we can correct back into the zone of 138.40 and then go back into the full bull swing of things And Lastly we are sinking further to the 129.64 level looking for a entry on another bull run up, if we break lower then I dont know what to tell you other than our bull run maybe over ??? If you like the video: please share, boost, and follow or comment: give me feedback on what you currently see and why. Hope you have a great day trading Mindbloome Trading Trade What You See Long17:33by Mindbloome-Trading6
NVDA: Time to correct after renewing the ATH?Daily Chart (Left): Resistance at $140.76: The price is currently around a significant resistance level at $140.76, which is near the recent highs. This level is important as it aligns with the previous all-time high. Support at $130: Immediate support lies at $130, a previous resistance level, which has acted as a strong zone where buyers stepped in this month. A break below this level could lead to further downside pressure. 21-Day EMA: The price remains above the 21-day EMA, indicating that the overall trend is still bullish. The EMA has consistently acted as dynamic support during pullbacks in the current uptrend. Weekly Chart (Right): Ascending Channel: The price action is confined within an ascending channel, with the current price near the upper boundary of this channel. This indicates that the stock has maintained a steady uptrend over the longer term. Previous All-Time High (ATH): The stock has approached its previous ATH around $140.76, a critical resistance level. This level needs to be decisively broken for a continued bullish rally. However, after a quick breakout of this resistance this week, we see increased selling pressure. Conclusion: NVDA has made a new record high this week, briefly breaking the resistance at $140.76, which coincides with its previous all-time high. A true breakout above this level could lead to further bullish momentum, potentially targeting the upper boundary of the ascending channel. However, failure to break above could result in a pullback towards the $130 support level, with the 21-day EMA providing dynamic support. Traders should watch for a decisive move above the $140.76 level for a continuation of the uptrend. For more detailed technical analyses and insights like this, be sure to follow my account. Your support helps me continue providing valuable content to help you make informed trading decisions. Remember, real trading is reactive, not predictive, so let's stay focused on the key points described above and only trade when there is confirmation. “To anticipate the market is to gamble. To be patient and react only when the market gives the signal is to speculate.” — Jesse Lauriston Livermore All the best, Nathan.by Nathan_The_Finance_Hydra7
Swing vs. Scalping: Who Really Wins?In the world of trading, data from industry sources often paints a picture that can be misleading for individual traders. Brokers and trading platforms promote high success rates, particularly for more frequent traders like scalpers, but the reality is often far more complex. In this post, we'll break down some of the numbers presented by industry sources and contrast them with independent research to give you a clearer perspective. Industry-Sourced Success Rates According to various industry sources, here’s what the reported success rates look like: Scalper (Under 5-minute operator): Success Rate: 50-70% Reasoning: High trade frequency. Small price movements. Greater liquidity. Short-term trend strategies. Swing Trader: Success Rate: 30-50% Reasoning: Lower trade frequency. Larger price movements. Greater exposure to risk. Medium to long-term trend strategies. At first glance, it seems like scalping offers a better chance of success. More frequent trades, combined with the liquidity of short-term moves, are presented as reasons why scalpers may be more successful. But should you trust these numbers at face value? Conflicts of Interest in Industry Data These industry-reported numbers may not be as reliable as they seem. Several potential conflicts of interest come into play when brokers and trading platforms promote certain types of trading: Platform Promotion: Platforms often highlight strategies that lead to more frequent trades, as these generate higher commissions for brokers. Attracting Active Traders: Scalpers tend to make more trades, and brokers benefit from the higher transaction volume. Risk Policies: Some platforms may structure their risk management tools and incentives to favor short-term trading. What Independent Sources Say When we look at independent, non-conflicted sources, a different picture starts to emerge. Independent academic studies suggest that swing traders may actually perform better than scalpers, for several reasons: Lower Trade Frequency: Swing traders typically make fewer trades, which reduces the impact of commission fees and spreads on their returns. Focus on Trends and Fundamentals: Swing traders often use technical analysis and fundamental factors to capture larger price moves, improving their potential for larger gains. Better Risk Management: With more time between trades, swing traders tend to employ more disciplined risk management practices. Less Stress and Fatigue: Scalping requires constant focus, which can lead to poor decision-making due to stress or fatigue. Independent Studies: Swing Traders vs. Scalpers Let’s take a look at some independent studies that tell a different story from the industry narrative: University of California Study (2019): Found that swing traders had an average annual return of 12.6%, compared to 6.8% for scalpers. Journal of Trading Report (2018): Showed a success rate of 55.6% for swing traders, compared to 41.4% for scalpers. QuantConnect Report (2020): Strategies based on swing trading delivered an average annual return of 15.6%, outperforming scalping strategies. These studies highlight how swing trading can offer better risk-reward profiles compared to the fast-paced, high-stress world of scalping. Key Takeaways for Individual Traders The key lesson here is not to fall for marketing hype or industry reports that may push you towards a specific style of trading, especially one that benefits the platforms you trade on. Here’s what you should keep in mind: Be Critical: Always question the sources of information. Industry success rates might be skewed by conflicts of interest. Independent Research: Seek out independent studies, academic journals, and unbiased platforms to get a clearer picture. Understand Your Goals: Both swing trading and scalping come with risks. Choose a trading style that fits your goals, risk tolerance, and lifestyle. Focus on Long-Term Growth: While scalping may seem exciting, swing trading tends to offer better long-term results by focusing on fewer, higher-quality trades with disciplined risk management. Recommended Resources for Objective Information Academic Journals: Journal of Trading, Journal of Financial Markets. University Studies: Seek out financial studies from universities like Stanford or Berkeley. Independent Platforms: QuantConnect, Backtrader. Specialized Blogs: TradingView, Investopedia. In conclusion, while the industry may promote fast-paced trading with promises of high success rates, the reality for individual traders is often quite different. Take the time to educate yourself and base your decisions on unbiased, independent information to improve your chances of success. P.S. Stay tuned for my next post, where I'll dive deeper into the topic, going beyond the potential use of misleading advertising. I'll demonstrate, using statistical methods—specifically, a covariance analysis—why larger time frames, like those used in swing trading, are mathematically more favorable for individual traders. Don't miss it! Disclaimer: This post is for informational purposes only and does not constitute financial advice. Trading is risky, and you should always conduct thorough research or consult a financial professional before making any investment decisions.Educationby CF_4444
NVDA Great ROI Trade To 150 Good morning Trading Family The market corrected a bit deeper than expected however we got a correction lol We have a great bullish opportunity from the 139.80 level to enter in so we go to the levels of 150 possibly beyond I give you my reasoning on what I see and why Mindbloome Trading Trade What You See Long07:35by Mindbloome-Trading8838
NVDA Bearish Elliott Wave AnalysisDisclaimer: I did this analysis with a strong bias that the market is overrun and purposely look for a bearish case for NVDA since it seems to be the one stock that is forcefully pulling the indices up. All other usual way of analyzing waves will give NVDA a target above $153. In this analysis, I gave the following points: 1. On the weekly chart, we can see a clear downtrend in volume (can be seen on daily too). 2. RSI divergence on the daily. 3. An irregular correction W-X-Y-X-Z. 4. Fibonacci Target of the last wave. Please use this with caution and only as a reference on how a bearish case for NVDA could be.Short08:08by yuchaosng8814
NVDA Technical Analysis for Oct. 23, 2024Key Levels: High: 144.51 Low: 136.75 Current Price: Around 143 Support Levels: Immediate support around 141.78 Stronger support around 140.87 and 136.75 Resistance Levels: Resistance at 144.50 (previous high) Next key resistance could be around 146 (upper trendline) Trend Analysis: Price Action: NVDA is currently trading in an upward channel, staying above key support levels. There’s a minor consolidation just below the resistance zone of 144.50. Volume: Volume appears to be decreasing after an upward push, suggesting a potential slowdown in momentum. However, we need to see tomorrow’s volume to confirm. Moving Averages: Looks like the price is above short-term moving averages, indicating near-term bullishness. Possible Scenarios for Tomorrow: Bullish Scenario: If NVDA breaks and holds above 144.50, it may push higher towards the 146 level or beyond, testing the upper channel line. Watch for strong volume confirming this breakout. Bearish Scenario: If NVDA fails to break 144.50 and breaks below 141.78, it may test 140.87 or lower, possibly heading toward the lower trendline near 136.75. Momentum: Momentum seems neutral, with no strong indicators of oversold or overbought conditions at this moment. My Thoughts: Potential breakout if the price breaches the 144.50 resistance level, but failing that, it could test support. A period of consolidation may also be possible, with the price staying range-bound between 144.50 and 141.78. This analysis is not biased and purely based on the factual data presented by the chart. Disclaimer: This technical analysis is for informational purposes only and not financial advice. It is based strictly on price data and indicators with no bias. Always perform your own due diligence or consult a financial professional before making trading decisions.by BullBear-Insights7