RBLXNot much to work with below most technical patterns and support levels, only thing I can see now for some calculated trendline support level is down towards $40-45 range of we get further correction
RBLX trade ideas

breaking extreme support 🍿rblx breaking below all time low support! not a good sign for longs..
also saw fresh rejection at trend resistance recently, that was a perfect entry if you were looking to go short.
look for a move to 55.9-48.6-41.7 in the near future!
like and follow for more 💘

$RBLX - Knifed Through Support$RBLX is looking really grim.
A loss of support at 60 means we're in no mans land right now. Tread extremely carefully, we don't know where price will settle.

Roblox the Metaverse ThemeRoblox has fallen to $60 since the high. The current price would provide good support to the current stock .
We expect upside from here so long as weekly candle does not close below $60.

$RBLX - At support from IPO price level What a horror show! The stock is currently back to IPO price level of $60ish. The area has acted as support prior three times. This area is also 2.618 Fib extension level support.
If it can't hold, we are looking at $34 area as next support level in FIB extension measure.
I thought $80 would give a descent support with $70 level being strong support. But it broke through both supports and did the unthinkable $60 support.
If the price bounce from here, we can expect it to travel towards upper trend line area of $90. But it will not be smooth sailing as it would have to travel through $72 and $80 resistance area.
Can it hold? We can only hope.
Bullish Target - $90
Bearish Target - $34
All depends on how it play out at current $60 support level.
———————————————————
How to read my charts?
- Matching color trend lines shows the pattern. Sometimes a chart can have multiple patterns. Each pattern will have matching color trend lines.
- The yellow horizontal lines shows support and resistance areas.
- Fib lines also shows support and resistance areas.
- The dotted white lines shows price projection for breakout or breakdown target.
Disclaimer: Do your own DD. Not an investment advice.

$RBLX TO $64.00RBLX- We are looking to perform a bit of a pull back but we are coming down to 64.00 for sure with this kind of support being broken

RBLX The way I see it $65.92 is a great buy zone, if it breaks above $72.18 we probably go to $84.00... thoughts??

RBLX to fill downside GAPRBLX rejection @119.73 possible bear movement looking to fill gap to the downside.
First TP @109.26 for short moves
Expecting to fill gap @82-78

RBLX potential 100%RBLX looks like a cup and handle with low stochs on the daily, 3 day, and weekly timeframes. Metaverse/gaming/stocks play

RBLX Potential LongKeeping an eye on this one after a recent gap fill. After a large 43% decline over the last 3 months things may finally be shaping up for a long play on RBLX. The setup is promising with a strong intraday reversal on a bullish hammer bar on 1/10/22. Ideally I'd like to see it stabilize a bit more, form a floor around 86 and break trend higher before taking a long position. Regardless, an interesting opportunity in a promising sector. RBLX has experienced strong revenue growth over the last 3 years (despite negative net income due to high developer exchange fees), and although growth for daily active users in the US has slowed, it continues to grow outside the US, where there is a larger opportunity for expanding market share.

RBLX RSI Divergence. Could a big bounce be coming?Chart is showing an inflection spot for price action here. Needs a bounce before it breaks down.

Roblox USA Sun Storm Investment Trading Desk & NexGen Wealth Management Service Present's: SSITD & NexGen Portfolio of the Week Series
Focus: Worldwide
By Sun Storm Investment Research & NexGen Wealth Management Service
A Profit & Solutions Strategy & Research
Trading | Investment | Stocks | ETF | Mutual Funds | Crypto | Bonds | Options | Dividend | Futures |
USA | Canada | UK | Germany | France | Italy | Rest of Europe | Mexico | India
Disclaimer: Sun Storm Investment and NexGen are not registered financial advisors, so please do your own research before trading & investing anything. This is information is for only research purposes not for actual trading & investing decision.
#debadipb #profitsolutions

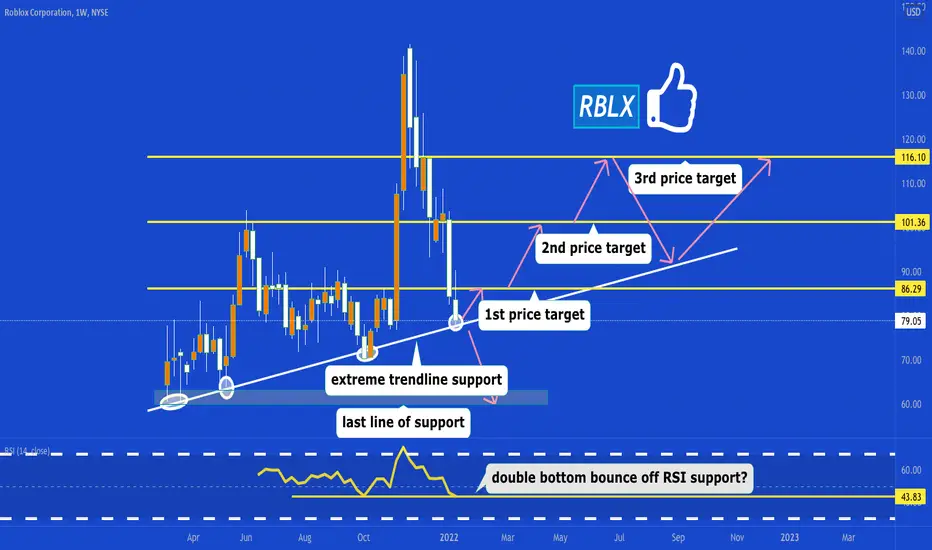
On my watchlist next week 🦉rblx sitting at a extreme trendline support, If it holds we should see a bounce to 86.29-101.36-116.10 in the near future, if we break below a test of last line of support (60-63) is possible.
like and follow for more 💘
$RBLX - the gap has been closed! What's next?In my previous chart, I stated that the gap was going to close. Now that the gap has been closed, let's see how things can play out.
If we look at the chart to the left current area of $78 - $80 has been a good support. So there is a chance it can hold this time.
But due to the popular nature of the stock and wide swings in price, MMs may try to bring it down to $75-$70 area in stop loss hunt to fill large client orders on the cheap.
What will it be? I don't know.
If the support holds, we can bounce to $93 area.
If not, we can see $70.
One thing to note, the RSI for this stock has not seen over sold territory before. It is currently close to 33 where it has bounced before. We will see.
———————————————————
How to read my charts?
- Matching color trend lines shows the pattern. Sometimes a chart can have multiple patterns. Each pattern will have matching color trend lines.
- The yellow horizontal lines shows support and resistance areas.
- Fib lines also shows support and resistance areas.
- The dotted white lines shows price projection for breakout or breakdown target.
Disclaimer: Do your own DD. Not an investment advice.

BOUNCE RBLX seems to try and be basing here with large order flow. i would like out of this name with a decent amount of room to the upside. Ideally want to see this stay above the order flow around 79 dollar area and then begin to push up and base over the 80-82 levels to show signs of reversal. for definitive reversal a break of the downtrend with strength will be your strongest indicator. would love to get this ticker to test triple digits again. Resistance above is highlighted with the horizontal line
Not Financial Advice


RBLX, 14 Jan. Support at the End of the Tunnel.RBLX approaches an area of geometric confluence which indicates a potential support. Roblox has seen some insider selling, but also secured new funding and established web3 & metaverse partnerships in January.
Geometry:
The green support/resistance diagonals cross at $75.
Elliott:
We can count a completing ABC correction. The 78.6 fib retracement is around $73.
Oscillators:
The Stochastic is oversold since mid-December and due to move back up. The RSI is about to enter the oversold area.
Volume:
Declining volume signals a potential exhaustion of sellers.
How to trade it:
The idea is to try a long position in the area between the 78.6 retracement and the green trend line. If price continues to decline, a double bottom at $70 would be the next possibility for an aggressive entry. Indices, especially mega caps, must stabilize for a bullish environment for this idea to work.

RBLXRBLX is back within this wedge...while it is at a pattern completion zone at the end of it harmonic which could turn out to be bullish....it does have a gap to fill but as of right now the gap is acting as support....we will see

Elliott wave practiceThis is not financial advice. First attempt at predicting a wave. 1 - first impulse move. 2 - retracement that did not pass the start of wave 1, and is a zig zag pattern. 3 - extended impulse move. 4 - retracement that did not enter the territory of wave 1, is a wedge (different from wave 2), and because wave 3 was extended, tends to give back up to 38.2% of move 3. My prediction for wave 5 is a direct copy of wave 1 because if wave 3 is extended, wave 5 generally will be equal to the duration and magnitude of wave 1. Not quite sure how to fib out the correct extensions (wave 5 targets should be relative to wave 3?). If anyone has feedback, please let me know.

$RBLX Roblox gap close and go ? Roblox has caught some attention after reports showed Nancy Pelosi (greatest trader of all time ;) ) purchased JAN 23 $100 Call options back in DEC.
I like it because it appears to have completed it's downtrend , although not yet confirmed, since closing the NOV gap and putting in a higher low so far.
With heavy resistance at $95, bulls aren't out the woods yet... lot of supply above.
Technically there is major BULLISH divergence on the CMF indicator implying smart money is buying the dip. With a decent VP void above an idea would be :
SHORT TERM - trade up to the $95 resistance
LONG TERM - Follow the Trade Guru Pelosi and go Long leaps JAN $100 Calls, then sell shorter term calls against it on the up days (diagonal spread)
Fundamentally their revenue is projected to grow to almost $5B in 2024 and the average analyst PT of 11 analysts is $117 a share (well above the current price of $89 a share).
Let's see !

RBLX...gap covered. is downside over?Roblox Corp. has retraced all the move since the breakout of last November folliwing its earnings call. A couple of days ago it covered the gap (purple) left back then and has started to move higher. The Yellow line ($77) is the level to watch in the next few days, this area needs to hold in order to think that the correction is over and a break of the blue trendline could be confirmation of it. Keep an eye on the technology sector and other metaverse stocks for guidance while we wait for new signals.

RBLX: Double HarmonicsThis is an analysis that one of my followers asked me to check for him and look at here what we have.(thanks buddy)
A double combination of "Bullish Harmonic Patterns"
A beautiful combination that you can't see very often.
The price looks like it tested a strong support area close to 79.50
It looks like the price is already changing the direction.
Anyway, we need to be careful as the price is in a bearish daily trend.
Red Targets = For the Red Pattern
Green Targets = For the Green Pattern.
Please check the fundamental information of the company yourself before investing in any stock.
Thank you and Good Luck!

RBLXWe are still in the channel, a strong buyback from the fibo level and levels, divergence on CMF, RSI at minimum levels (relative to the history of this stock). In fact, the GAP was closed.
Yellow fibos are not in the logarithm.
