RBLX - oversold/golden pocketRBLX is a name I missed the first time around, can't play all the names, but looks like another opportunity is here. Another golden pocket bounce would play out huge. The best way to play it in my opinion is again a starter position with the expectation of adding into the golden pocket. Clear stop loss would the a loss of the .707 ($75). I don't think this name is done and expect all time highs soon if this holds.
RBLX trade ideas

RBLX Swing or Long TrermRecent IPO RBLX experienced a nice breakout from it's IPO base. It is now pulling back a long from the key area within the demand zone could be considered.

RBlX BUllCatching support in key area with divergence spotted
With recent up tick in rblx use, I see this going back to AVG 95.04

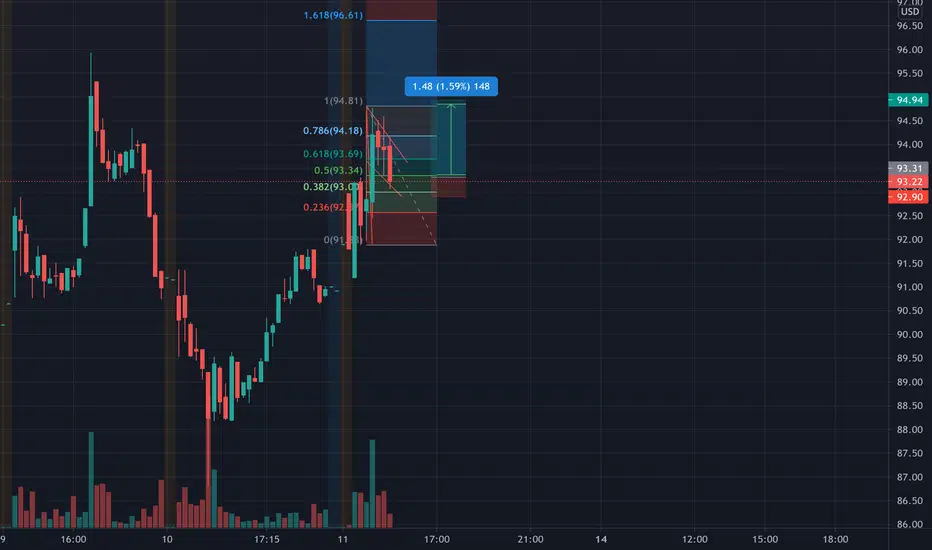
Roblox Possible ReboundRBLX could rebound from 0.6 Fibo Retracement supported by hypothetical rising channel.

RBLX longRBLX at 82.80. Looking to test new support 78.00 and bounce up. Playing the two gaps in the volume profile. Take profits at 83.00 (.382FIB) and 86.00 (.5FIB). Cathie Woods picked up 134,250 shares so why cant I ?

Is Roblox ready for a pullback?It's been a great run for RBLX since coming public. For almost 15 months, we've all been stuck at home playing video games and investing in meme stocks. Unfortunately, the company released an update today which Wall Street didn't like very much. A 28% YoY increase in active Roblox gamers for the month of May seems like pretty good news to me. Unfortunately, it's a decrease of 1% from the month of April. Yeah, so... maybe a few of us want to get out now that we don't need to wear our masks?
I'm a bull at heart but when I see this chart, I want to short this stock (at least short-term). What do you guys think?

RBLX dipped back into the channelI am into RBLX because my kid keeps asking me to buy him coins in the game. I figured I could help him earn some coins (lol).
When institutional investors started buzzing about it more after it's first earnings, I had a hunch it would soar. Well it happened and now it's cool down time as indicated by lower volume. I think that price will retrace to about $96 before dropping more. I am a novice charting queen aiming to be right. This 4hr view shows the highlights, but drilling down to the 1hr chart may help you see a more familiar to determine your entry and exit strategies. Once more price action takes place, I hope to see when RBLX will rise again (summer 2021).


RBLX Supply & Demand RBLX Trade Idea - RBLX previously bounced off demand twice, looking to watch trend line break and take it long to supply zone.

$RBLX Still LONG Despite yesterdays sell off with news to near the $80 level, we see buyers entering this morning raising it nearly 6 points giving me confidence for a longer term reversal. Still expect to see 100-110 price level in the next 4-6 weeks. targets as well as support and resistance are trend based fibonacci extension levels as shown on the chart.

$RBLX Rebound Tomorrow? Elliot Wave Says So!Video breakdown on $RBLX after a harsh pullback, but a pullback may have been just what it needed! Lets see what happens tomorrow!

$RBLX Retest $100 Short Term RBLX with a decent swing setup here back towards $100 short term, support on top of the previous resistance level showing a solid reversal on a 4HR chart.


$RBLXneeds to hold above both EMAs and hold momentum/continuation to enter but areas of interst to watch if it does

Waiting for a chance to Buy Robux?downtrend has started for Roblux as it still fail to hold above $94 and close above it.
Next 2 support are around $85.6 and $77.50.
Will be waiting for a chance to Buy some at $75-77 range. Meantime, monitor the mkt for more volatility to come and dyodd.

RBLX, if you did not sell already, HODL!!Some Basic looks to those on this trade.
went over extended at $103, it was due to fall
waiting for prime locations, solid support around $78-$84,
looking for target price range $125


$RBLX - Classic case of "The trend is your friend until the end"$RBLX broke its massive uptrend and made a solid move south. Puts are finally paying off as this stock is due for a correction.
Let's break down what happened here and how you can profit from similar price action.
Step 1: Find a trend and draw a trendline. The bigger the time frame, the stronger of a trend it is.
Step 2: Wait for a break. Do not enter simply because the stock is overbought, enter on confirmation and confirmation ONLY!
Step 3: Wait for confirmation, see chart for details
Step 4: Define your SL and price targets. These can be based on a variety of factors, but this is mine for $RBLX
Since this is a major trend break I have a tight SL. As any move further north would invalidate this trend. This stock also sits at a major resistance giving me more confidence in this trade.
Join the link in my bio for a chill trading room and get in these trades before they happen!
Cheers!
Bonus tip: It can also help to follow the overall market, $SPY , $QQQ and the broader market were performing weak today which also helped my bias


RBLX Strong Growth Potential - Roblox I am Familiar with this company as all my children play or use some game on the
Roblox Network . Upon having to submit my debit card info to the kids to top up on some power they need
in game or to reach a new level I can say that Roblox have captured there market very well .The Kids to Play and the Adults to Pay .
With better than expected results on the last earnings and the current picture on world affairs I can see a strong argument for growth in this sector .
This is a newly listed company and as drawn on the chart we are trading within a Ascending Channel and are currently testing the top of the channel.
We may break out of the channel but I expect to back test support which sits at the point of control and a FIB .618 pull for additional confluence.
This will be a great Buy opportunity when it presents itself , in the meantime set an alert close to this region and be prepared to pull the trigger for a stock that
has Strong growth potential .
Ensure you know your Invalidation and use a SL , any questions then please ask , Drop me a LIKE and FOLLOW for regular Setups.

ROBLOX 4H Doji + Triangle A doji appeared in the last 4 hours of trading of Roblox. Typically a doji reflects indecision within the market where buyers and sellers cancel each other out.
When it happens at the top of a move it can signal a reversal. However, 4 hours isn't much to go on (I'd feel better on a daily chart) and these things appear a lot and often lead to nothing. So check for confirmation in the next candles.
There is also a triangle forming and today was a new high completing the top line.
Option 1 is a move higher once the triangle is broken, it could be after a slight move down (due to that doji) which presents a buying opportunity if the triangle holds.
Not a super helpful chart, I probably should have just written "watch out for that doji" and left it there :)

Long On RBLXPerfectly following the second ''Wyckoff accumulation schematic 2'' pattern and we are about to head into phase E.
