A cyclical long idea for a travel cruiseThe main long cyclical idea came after I remembered what happened to cruise companies in the pandemic era that generated a bear market for them, but now I have to say the market has been regaining their up cyclical trend.
RCL trade ideas

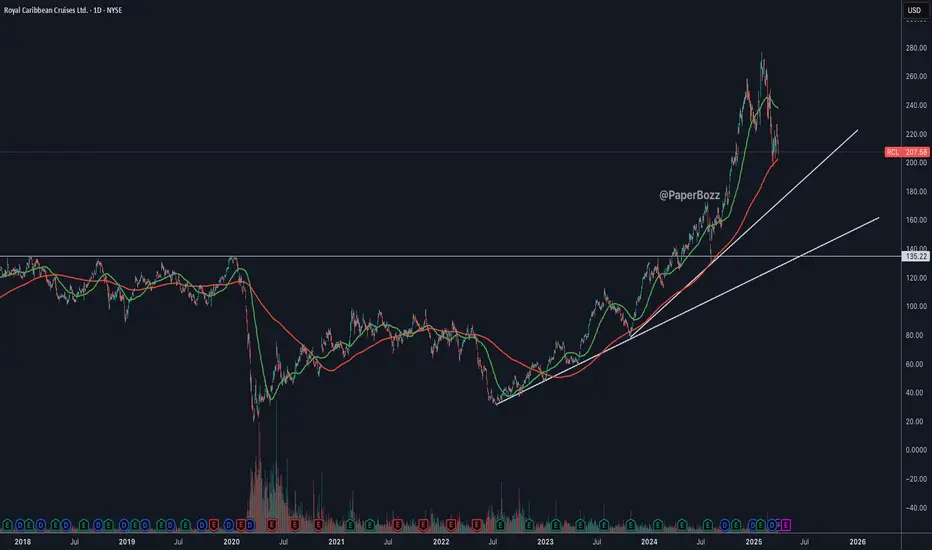
RCL Eiffel Tower CAUTION! UPDATERCL is in a very capital-heavy industry that is very economically sensitive.
I first published this Idea back on February 11, 2025. Since then, it has dropped over -40%.
Normally, I would say that from erections come corrections. However, this has the Eiffel Tower structure in place for a full-on reversal.
I am reposting this chart since TV forced me to post a "target reached."
Here is the original post.

RCL Eiffel Tower CAUTION!RCL is in a very capital-heavy industry that is very economically sensitive.
Normally I would say from erections some corrections. However this has the Eiffel Tower structure in place for a full-on reversal. That remains to be seen. For now, we look for at least a correction and go from there.
Caution is in order if you are long.

$RCL - Possible trendline retestNYSE:RCL I don’t think the 200-day moving average (DMA) will hold this time. It will have to fall back to the trendline. The question is, will it stop at the first trendline?
Royal Caribbean Hovers Near GapRoyal Caribbean hit an all-time high four weeks ago, but it’s been sliding since.
The first pattern on today’s chart is the series of lower highs since January 31. Notice how each followed a tepid uptrend that failed to hold. The last may be viewed as a bearish flag within the context of a new short-term downtrend.
Speaking of short-term downtrends, the 8-day exponential moving average (EMA) is below the 21-day EMA. MACD is also falling. Those patterns may reflect a bearish direction.
Third, prices tried and failed to hold the rising 50-day simple moving average. That may suggest its intermediate-term trend is negative.
Next, earnings lifted RCL on January 28 but the rally didn't hold. Are investors abandoning ship on the fundamental story?
Finally, the cruise ship operator jumped above $220 on November 6 after the election. That could make traders look for prices to test that gap.
TradeStation has, for decades, advanced the trading industry, providing access to stocks, options and futures. If you're born to trade, we could be for you. See our Overview for more.
Past performance, whether actual or indicated by historical tests of strategies, is no guarantee of future performance or success. There is a possibility that you may sustain a loss equal to or greater than your entire investment regardless of which asset class you trade (equities, options or futures); therefore, you should not invest or risk money that you cannot afford to lose. Online trading is not suitable for all investors. View the document titled Characteristics and Risks of Standardized Options at www.TradeStation.com . Before trading any asset class, customers must read the relevant risk disclosure statements on www.TradeStation.com . System access and trade placement and execution may be delayed or fail due to market volatility and volume, quote delays, system and software errors, Internet traffic, outages and other factors.
Securities and futures trading is offered to self-directed customers by TradeStation Securities, Inc., a broker-dealer registered with the Securities and Exchange Commission and a futures commission merchant licensed with the Commodity Futures Trading Commission). TradeStation Securities is a member of the Financial Industry Regulatory Authority, the National Futures Association, and a number of exchanges.
TradeStation Securities, Inc. and TradeStation Technologies, Inc. are each wholly owned subsidiaries of TradeStation Group, Inc., both operating, and providing products and services, under the TradeStation brand and trademark. When applying for, or purchasing, accounts, subscriptions, products and services, it is important that you know which company you will be dealing with. Visit www.TradeStation.com for further important information explaining what this means.

$RCL - A Bounce off the Rising Trend LineRCL is exhibiting a bounce off a rising trend line on the daily chart, suggesting a continuation of an uptrend. A rising trend line typically connects higher lows, indicating sustained buying pressure over time. This bounce could signal a resumption of bullish momentum after a pullback to test support.
RCL saw quite a bit of strength into the close, getting the stock above the 5 day MA. Couple this with a move off a volume shelf and RCL presents a nice setup with a reward to risk ratio of better than 2:1.
An entry at Friday's close (assuming RCL does not gap up on Monday) has a price target of previous highs at $277.00. This is a 12% gain to the upside. A stop loss just below the bottom of the rising channel gives a 5% stop loss. The ADR is $9.90 per day, so this stop loss gives RCL enough room to move without being stopped out.

RCL BUYRCL Buy set up on the Daily. Nice bounce off the Monthly S1 pivot point and a pullback into Fib buy zone. Nice R/R

Earnings BreakoutI love the earnings season. During earnings season we see great setups that are tradable almost every day.
This is also the case today with RCL . Breakout under enormous volume and high relative strength. NYSE:RCL

Royal Caribbean Cruises Ltd. (RCL): Leading the Cruise IndustryRoyal Caribbean Cruises Ltd. (RCL) is one of the world’s largest cruise lines, offering unforgettable travel experiences across stunning destinations. Known for its innovative ships, Royal Caribbean combines luxury, entertainment, and adventure for travelers seeking memorable vacations. The company’s key services include cruises, onboard activities, dining, and excursions, making it a leader in the travel and leisure industry.
Royal Caribbean’s growth is fueled by increasing demand for travel, fleet expansions, and a focus on sustainable cruising. On the stock chart, RCL recently displayed a confirmation bar with rising volume, pushing the price into the momentum zone. This indicates strong investor interest and potential upward movement.

RCL - crusing up the channel?CAPITALCOM:RCL has been on a steady upwards move on the daily since October of last year, keeping within a pretty narrow channel. No huge deviations up or down, just easing up. During the market turmoil recently, we saw a fake break of channel to the downside, which was quickly corrected back into the safety of the channel. Price is also respecting the 50 EMA, with some recent deviations due to the recent market reactions. MACD is turning up as a result and is on its way to green territory. RSI has crossed the signal line, these are the two indicators I most often follow. On the fundamentals the company slightly beat expectations on its latest release. JP Morgan said recently that cruises are now 20% cheaper than land-based alternatives (vs. 10-15% cheaper in 2019), and they predict a shift in favor of cruising. And, they just this week labeled CAPITALCOM:RCL "best in class" among cruise lines. In terms of analyst ratings (I usually focus on technicals), according to Stockanalysis.com 16 of 18 analysts has a Buy or Strong Buy recommendation on the stock (Strong Buy: 10, Buy: 6, Hold: 2). Expect CAPITALCOM:RCL to move up towards the channel roof, setting target 1 around $173 as this is ATH. Seeing as there is no resistance above this, if it breaks it might move even higher.

Buy Royal Caribbean CruisesShort Term Trading Advice by Naranj Capital
Buy Royal Caribbean Cruises
● Buy Range- 228 - 233
● Target- 245 - 248
● StopLoss- 222
● Potential Return- 5-6%
● Duration- 12-14 Trading Days

$RCl - new all time highs incomingRCL - stock in uptrend as holiday season approaches. Stock making higher low on daily time frame and looking bullish for a move towards all time high. looking for calls above $235 for a move towards $240 and higher. Stock is strong on indicators.

ROYAL CARRIBEAN CRUISES RCL (NYSE) Long D11st Buy Limit @ 163.48
2nd Buy Limit @ 160.67
S/L @ 149.27 (same for both entry)
T/P1 @ 196.64
T/P2 @ -------
R.R.R. @ 1/2
Pure Price Action Trading based on Pullback, Breakout of Key Level.

Royal Caribbean - RCLRoyal Caribbean witnessed a rebound after forming a higher low at 167.86$, violating the major peak 173.37$ in Friday's session, and the confirmation of this breakout by remaining trading above 173.37$, will confirm the major uptrend in short and medium-term, triggering further rises near 179$ - 185$ - 189$ - 200$.
support1: 173.37$ - support2: 169.47$ - resistance1: 179$ - resistance 2: 185$
The stop-loss lies below 167.86$.
the indicators are heading toward the positive side, which confirms the mentioned positive scenario.
The information and publications are not intended to be or constitute any financial, investment, commercial, or other types of advice or recommendations provided.

RCL Crossover Swing IdeaNYSE:RCL
Buying at market open
Looking at the Sept 27 bull put spread of
-170p / + 165p for ~2.47 credit with a max loss of ~2.53
SL: 158.98
TP: 173.35
Max Date: Market open 9/25/24

RCL Royal Caribbean Cruises Options Ahead of EarningsIf you haven`t bought RCL before the previous earnings:
Now analyzing the options chain and the chart patterns of RCL Royal Caribbean Cruises prior to the earnings report this week,
I would consider purchasing the 165usd strike price Calls with
an expiration date of 2024-10-18,
for a premium of approximately $13.95.
If these options prove to be profitable prior to the earnings release, I would sell at least half of them.


Royal Caribbean ramps up hiring amid record cruise demandRoyal Caribbean Group (RCL) is significantly expanding its workforce in response to unprecedented demand for cruises. The cruise operator is currently discussing with various countries to recruit thousands of new employees for its ships and private destinations. This year, the company aims to hire approximately 10,000 workers, with plans for an additional 10,000 next year to support the launch of three new ships.
Despite a 6% reduction in maritime staff in 2023, Royal Caribbean's onshore headcount has increased by 17%, highlighting a clear need for more personnel. This staffing strategy coincides with a surge in bookings, which reached record levels in Q1, contributing to a notable rise in revenue and share price.
Exploring potential trading opportunities, here is a technical analysis of Royal Caribbean Group (NYSE: RCL):
On the Daily (D1) timeframe, the stock shows a resistance level at 143.60 USD and support at 127.10 USD. The stock has been in a global uptrend since July 2022, suggesting room for further growth. If the trend changes, the downside target could be around 116.50 USD.
If the price breaks through the resistance at 143.60 USD, a short-term target could be 150.00 USD. From a medium-term perspective, it could reach 162.00 USD.
—
Ideas and other content presented on this page should not be considered as guidance for trading or an investment advice. RoboMarkets bears no responsibility for trading results based on trading opinions described in these analytical reviews.
The material presented and the information contained herein is for information purposes only and in no way should be considered as the provision of investment advice for the purposes of Investment Firms Law L. 87(I)/2017 of the Republic of Cyprus or any other form of personal advice or recommendation, which relates to certain types of transactions with certain types of financial instruments.
Risk Warning: CFDs are complex instruments and come with a high risk of losing money rapidly due to leverage. 69.88% of retail investor accounts lose money when trading CFDs with this provider. You should consider whether you understand how CFDs work and whether you can afford to take the high risk of losing your money.

Royal Caribbean Cruises Ltd. Short PositionHi traders,
Turning our attention to Royal Caribbean Group (RCL), we can see that it has formed a rising wedge pattern over the past few weeks, indicating a potential bearish reversal. Despite recent challenges, Royal Caribbean Group remains a dominant player in the cruise industry with strong brand recognition and a loyal customer base.
However, it's essential to note that Royal Caribbean Group faces significant headwinds, including ongoing concerns about the recovery of the travel and tourism industry.
Additionally, the company's financial position may be challenged by its substantial debt burden, which stands at nearly $20 billion.
Furthermore, technical analysis reveals that Royal Caribbean's price has formed higher highs and higher lows, converging towards a point of potential breakdown. There is also a bearish divergence observed in indicators like the Relative Strength Index (RSI), indicating weakening
momentum despite the upward price movement. This divergence suggests that a reversal in the stock's trend is likely.
As the breakdown of the rising wedge pattern becomes imminent, preparing for a potential short position at this stage appears reasonable. The entry point could be initiated upon confirmation of a break below the lower trendline.
1st Take Profit: 112.74
2nd Take Profit: 102.9
Final Target: 79.95

⚓🚢 Royal Caribbean Cruises (RCL) Analysis 📈🌊Post-Pandemic Rebound:
RCL poised to benefit from the strong rebound in the cruise industry post-pandemic, with passenger numbers surpassing pre-pandemic levels. Growing popularity among younger demographics and new passengers indicates expanding market appeal.
Strong Demand:
RCL has booked a significant portion of its 2024 occupancy, despite strong pricing, highlighting robust demand for its offerings. Plans to increase capacity by 5% further affirm its market strength.
Investment Outlook:
Bullish outlook on NYSE:RCL above $121.00-$122.00.
Upside target of $180.00-$182.00 reflects potential growth and value appreciation as RCL capitalizes on the resurgence in cruise travel.
🛳️📊 Stay tuned for RCL's voyage ahead! #RoyalCaribbean #InvestmentAnalysis 🚀🌐

RCL may set up a fall from a rising wedge SHORTRCL took a bit of time to recover from COVID but has now done well. The dialy chart reflects
this. Last year price rose in the winder and spring then fell when the summer ended and
reversed upside in November. Ir is now in a rising wedge and price is at the upper trendline.
It is confluent with the second upper VWAP band line suggesting not much room upside as
that line is providing dynamic resistance. The predictive algorithm from Lux Algo designed
to forward forecast from a lookback of the regression line to the left predicts a fall from
the ascending resistance trendline and the underside of that VWAP line. I will short
RCL here and entertain a hedged options trade to insure the short trade. I have shown a
peer stock NCLH from the cruise industry. It has not done as well as RCL. If RCL starts
falling significantly some traders may move their capital to NCLH and help it rise. I will put
NCLH on my watch list along with UAL, AAL, LUV, DAL and LUV as the summer travel
season will be underway in another sixty days and trader interest may rise with accumulation
and price action to follow.

Short term pain ahead?As I observe the day to day activity on RCL, I see the possibility of price dropping towards the low 100s between 113ish. The weekly timeframe overall up until now has been on a steady climb to the upside. So a strong dip into a fair value which would encourage investors to look for entry at a lower valuation when it comes.
Looking at the daily timeframe I've noticed a possible head and shoulders pattern appear which can signal some bearishness in this case it should be short term as the overall uptrend was quite valid up until news release of debt offering which can be good news for the longer term.
I see some upside in case this were to deep in the lower 100s in the days or weeks to come.

Royal Caribbean May Be Attempting a BreakoutRoyal Caribbean Cruises has spent more than two months consolidating, but it may be getting ready to move again.
The first pattern on today’s chart is the trendline along the closes of December 28 and January 31. RCL ended yesterday above it, which could make some traders think the stock is breaking out.
Prices are also pushing above their 50-day simple moving average (SMA). That could suggest the intermediate-term trend is getting more bullish.
Next, the 8-day exponential moving average (EMA) crossed above the 21-day EMA. That could suggest the short-term trend is getting more bullish. MACD has also turned positive.
Finally, you have the $112.95 level where RCL peaked in July. Last moth’s low was $0.15 above that price. Has old resistance become new support?
TradeStation has, for decades, advanced the trading industry, providing access to stocks, options and futures. See our Overview for more.
Important Information
Past performance, whether actual or indicated by historical tests of strategies, is no guarantee of future performance or success. There is a possibility that you may sustain a loss equal to or greater than your entire investment regardless of which asset class you trade (equities, options, futures or cryptocurrencies); therefore, you should not invest or risk money that you cannot afford to lose. Online trading is not suitable for all investors. View the document titled Characteristics and Risks of Standardized Options at www.TradeStation.com . Before trading any asset class, customers must read the relevant risk disclosure statements on www.TradeStation.com . System access and trade placement and execution may be delayed or fail due to market volatility and volume, quote delays, system and software errors, Internet traffic, outages and other factors.
Securities and futures trading is offered to self-directed customers by TradeStation Securities, Inc., a broker-dealer registered with the Securities and Exchange Commission (“SEC”) and a futures commission merchant licensed with the Commodity Futures Trading Commission (“CFTC”). TradeStation Securities is a member of the Financial Industry Regulatory Authority, the National Futures Association (“NFA”), and a number of exchanges. TradeStation Crypto, Inc. offers to self-directed investors and traders cryptocurrency brokerage services under federal and state money services business/money-transmitter and similar registrations and licenses.
TradeStation Securities, Inc., TradeStation Crypto, Inc., and TradeStation Technologies, Inc. are each wholly owned subsidiaries of TradeStation Group, Inc., all operating, and providing products and services, under the TradeStation brand and trademark. TradeStation Crypto, Inc. offers to self-directed investors and traders cryptocurrency brokerage services. It is neither licensed with the SEC or the CFTC nor is it a member of NFA. When applying for, or purchasing, accounts, subscriptions, products and services, it is important that you know which company you will be dealing with. Visit www.TradeStation.com for further important information explaining what this means.
