Tim's Fundamental View LayoutHere is the way that I view any stock for an initial analysis to get an idea of what the market is valuing and viewing the company.
I first look at the free cash flow, so that is directly under the price chart. Free cash flow is the life-blood of the company and can be used to pay dividends and to
Key facts today

Short RIVN before earnings that show further lossesShort and wait to short again until company is profitable

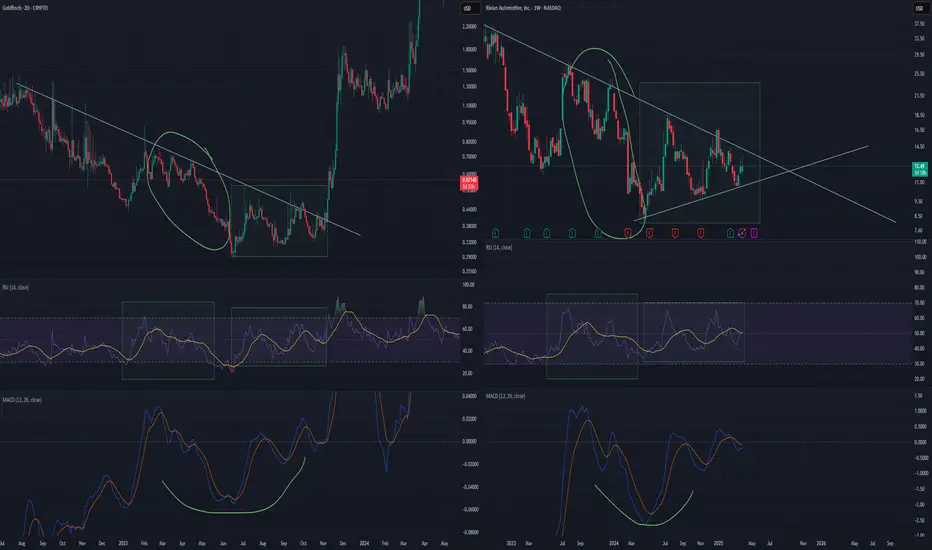
Is the trend changing for Rivian?NASDAQ:RIVN 's stock price, which has dropped by nearly 80% since September 2022, has started to move upward again in November 2024 with renewed demand.
The possibility of retesting the trendline formed during the 2022-2024 period has strengthened with the demand seen in the past month.
If this

Trading idea - Entry point > 12.24/61.80%Trading Idea
1) Find a FIBO slingshot
2) Check FIBO 61.80% level
3) Entry Point > 12.24/61.80%
Chart time frame: D
A) 15 min(1W-3M)
B) 1 hr(3M-6M)
C) 4 hr(6M-1year)
D) 1 day(1-3years)
Stock progress: A
A) Keep rising over 61.80% resistance
B) 61.80% resistance
C) 61.80% support
D) Hit the botto

Rivian's Revival Rivian seen a great loss of value for a number of years but I think it is time to reconsider Rivian. I expect Rivian to rise in the coming 2,3 maybe 5 years from now to a new all time high!

$700 incoming for RIVN. Blow it up.Guys this is not even funny. Risk to reward is literally out of this world.

Thank you Elon for Pumping RIVN to the MoonGuys, hold on to your pants. This one will crack the earth soon.
Rivian Kicking Off Potential UptrendHey, all. I'll get down to it. Obviously NASDAQ:RIVN has been an incredibly tough stock to own. Fake out after fake out. It has been brutal - unless you have been nimble enough to buy the dips and sell the rips.
I would like to posit, however, that NASDAQ:RIVN is going to start marching back h

RIVIAN Stock Chart Fibonacci Analysis 032525Trading Idea
1) Find a FIBO slingshot
2) Check FIBO 61.80% level
3) Entry Point > 12.3/61.80%
Chart time frame: C
A) 15 min(1W-3M)
B) 1 hr(3M-6M)
C) 4 hr(6M-1year)
D) 1 day(1-3years)
Stock progress: B
A) Keep rising over 61.80% resistance
B) 61.80% resistance
C) 61.80% support
D) Hit the bottom

RIVN LongDaily support line.
Trendline break
Entry 10.87
Stop 9
Target 18
Risk management is much more important than a good entry point.
I am not a PRO trader.
In my trading plan, the Max Risk of each short term trade should be less than 1% of an account.

See all ideas
Displays a symbol's price movements over previous years to identify recurring trends.


