Rocket companies inc. How to use wave analysis to forecast.After the completion of the ABC corrective structure we expect the next impulse up or it will develop to an ABCDE corrective structure. All cases are bullish right now. I will keep updating this chart if necessary. Comment, like follow for more accurate ideas. Thank you.
RKT trade ideas

First time posting.So making this chart based on moving average and it seems like it can brake the top line we should be able to move back to the 30 mark. Any feedback would be helpful :). (Not an expert jfyi, do your own research)

$RKT | Rocket 🚀 Descending Channel Breakout [Update 1]RKT formed a bullish channel after breaking out of a bullish descending channel. Price has consolidated for a while and I think it is ready to push higher.
See my previous analysis here:

RKT weekly close on the edge, long unless breakout invalidatedThis weekly RKT close looks a bit scary, literally on the edge, but I'm long unless the breakout is invalidated.


RKT - Buying to OpenBuying to Open 19FEB21 20 @1.35-1.50
Watching the 1hr for oversold entry in the 19.56 area.
Entry Target = 19.56
1st profit Target = 236fib @22.60
2nd Profit target = 382fib @24.14
HODL Target = 618fib @28.06+
______________________________________________________________________________________________________________________
This content is for informational and educational purposes only. This is not in any way, shape or form financial or trading advice.
Good luck, happy trading and stay chill,
2degreez

respect the trend lines! they never lie !little trend channel thats holding at down/sending it lower every time its tested, under 19 support we can expect a dip entry at 17.5, stop loss 16.5, price target 20. pretty solid risk reward here! goodluck :)


RKT ready for an uptrend?RKT MACD looks like its ready to turn green, and RSI is heading up. Would love to see it get above the 50 sma line. Either way this is a long term hold.

RKT to the MOONRKT has been trading in a channel since October. Right now it looks like it successfully tested the lower boundary and bounced back. This could potentially seek to retest resistance at $23 before continuing to go higher. Given the 32.34% short float (as of Jan 14) this might happen very fast and aggresively. Keep yours eyes on this one folks.


$RKT | Rocket Companies 🚀 Falling Wedge Breakout & Bull Flag $RKT formed a bull flag after breaking out of a falling wedge.
Watch for a breakout of the pink bull flag for further upside.
Targets: $20.50 and $21
Let me know what you think in the comments and leave a like if you agree with my analysis! 👍🏽


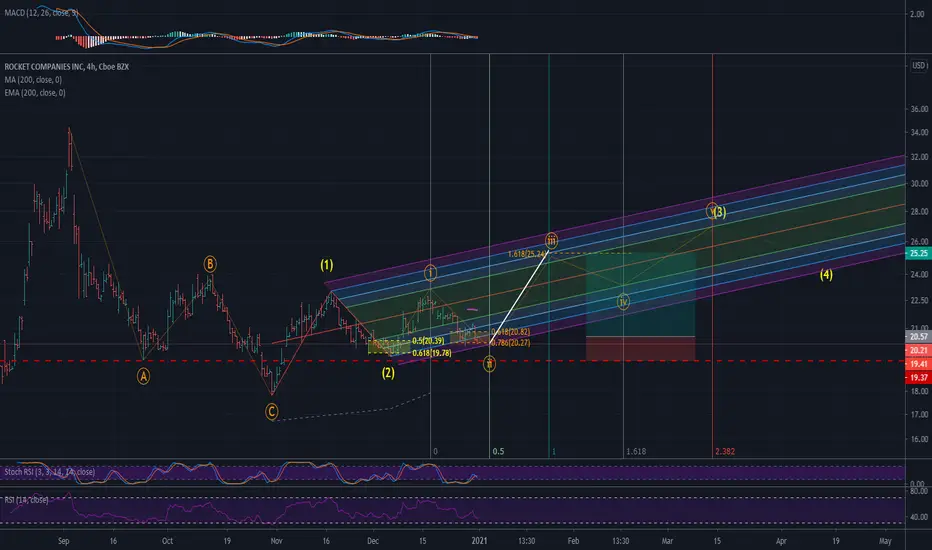
$RKT Short term target of $26 - UPDATEDThe previous count was invalidated when wave 2 retraced beyond wave 1. This looks more like a WXY double correction. Double corrections are 3-1-3 waves where the W and Y waves are ABC corrections, and the X wave is a 5-3-5 zigzag.
With the large price fluctuations after IPO, this sort of prolonged consolidation makes sense. If we are finally breaking this consolidation, we could be starting a wave 1. We need to break above 23 to break out of the larger triangle pattern. This could coincide with a 5 wave sub structure of the newly started wave 1, as shown on the chart. In this scenario, the sub wave 1 would get rejected at 23 initially, consolidate into a wave 2 before launching into a wave 3 that breaks the $23 soft barrier, consolidates again for a wave 4 and finally finishes wave 5 around $26.
The $26 target is a confluence of a major resistance/support level, the 50% Fib retracement of the larger wave 3 of the first cycle, as well as the 2.786 band of a modified schiff Fib pitchfork (a FibFork, if you will). The pitchfork is not shown on the chart to keep it clean.
Long story short, we need to see the following: A 4h close above $20.70 (to close above EMA's) followed by a breakout and 4h or 1D close above $23. Once that happens, its pretty clear sailing to $26.

$RKT Short term target of $25Looking for RKT to start its wave 3 later this week (jan 5th or 6th) and run up to $25 by end of January. If my time targets are off, this run up could take as long as mid February.
After that there doesn't seem to be too much up side in the short term.
In in shares at $20.57 and will look to exit at $25
MACD looking bearish. MACD is showing us red which an indication of a downtrend. Have not sold my position as this is a long hold. Will consider adding around these prices.


