ROST is correcting and that's OK - Long at 141.28People get panicky during corrections. Understandably, it can be nerve-wracking watching that stock you were sure was going up, going down. With the short term nature of the trading I'm doing, I don't worry that much, and especially when the corrections are garden variety ones.
ROST is down almost 10% since Dec 5th. That's a normal correction, especially for ROST. It's done that (or more) 4 times in the last 11 months, coming all the way back or more each time. Now I'm not predicting it will this time, too. The whole point of short term trading is not having to worry about earnings, the economy, who we enter a trade war with, etc.
But it is important to keep perspective and zoom out every once in a while. Looking too closely at the last two weeks for this stock could be unnecessarily frightening. 7 down days in the last 8. 4 in a row. Zooming out lets me realize that what's going on here isn't necessarily a crisis. It's (no pun intended) business as usual.
It helps that NASDAQ:ROST is one of my better stocks for trading the way I do. It also helps that there is some support relatively close. It helps that I have over 1100 backtested and real trades in ROST to look back on. When the history of the stock is 1122-2 (the 2 are the last two days), it makes the 10% drop lately seem less worrisome. Data is comforting in times of stress.
And those are lessons for everyone's trading, I think. Look at the big picture before getting nervous about the small one. Collect data on your trades, and let that story of success keep you calm in difficult times. And if it's a story of a lack of success, then at least you can avoid a mess before it happens and work on developing something new.
Per my usual strategy, I'll add to my position at the close on any day it still rates as a “buy” and I will use FPC (first profitable close) to exit any lot on the day it closes at any profit.
As always - this is intended as "edutainment" and my perspective on what I am or would be doing, not a recommendation for you to buy or sell. Act accordingly and invest at your own risk. DYOR and only make investments that make good financial sense for you in your current situation.
ROST trade ideas

ROST in a good demand zone…ROST is on a nice demand zone; huge chances for reversal till close to 150+.. R:R ratio 1:2.5

Second $ROST entry on bullish confirmation!Key Stats:
Market Cap: $51.9B
P/E Ratio: 24.65 (sector average ~22.5)
Free Cash Flow: $1.6B TTM
Next Earnings Date: March 4, 2025
Technical Reasons Supporting an Increase:
Ascending Channel Formation: ROST continues to trend upward within a well-defined ascending channel, targeting the upper band near $190.
Key Moving Averages Bullish Crossover: The 50-day SMA just crossed above the 200-day SMA—hello, golden cross.
RSI Momentum Breakout: RSI (14) remains at a healthy 62, suggesting bullish momentum without overbought conditions.
Fundamental Reasons Supporting an Increase:
Strong Q3 Earnings Beat: Revenue up 8% YoY with EPS growth of 12% (Q3 FY24). Management raised FY guidance, reinforcing investor confidence.
Off-Price Retail Resilience: Amid inflationary pressures, ROST’s model thrives by offering value-conscious customers an edge.
Expansion Plans On Track: 100 new stores planned by 2025, creating a pathway for revenue growth and broader market penetration.
Potential Paths to Profit:
Option 1 (Lowest Risk): Buy shares outright and hold.
Option 2 (Moderate Risk): Buy LEAP calls for potential returns based on implied move calculations.
Disclaimer:
We are not a brokerage or investment firm. We do not offer financial advice or investment advice and/or signals. This is not certified financial education. We offer access to the daily thought process of an individual and his experiences. We do not offer refunds. All sales are final.

You need $ROST to spell PROFITSKey Stats
Current Price: $154.87
52-Week Range: $113.77 - $159.16
P/E Ratio: 24.38 (moderate valuation for retail)
Market Cap: $51.38B
Revenue Growth: +5.8% forecasted YoY for FY 2025
Next Earnings Date: March 4 2025
Top 3 Technical Reasons ROST Will Increase:
Breakout Setup: The stock recently hit a resistance level at $155, forming a bullish continuation pattern. With strong volume, it could rally toward $190 over the next year.
Golden Cross Signal: The 50-day MA recently crossed above the 200-day MA, a classic bullish indicator.
RSI Momentum: Currently hovering, indicating bullish momentum without being overbought.
Top 3 Fundamental Reasons ROST Will Increase:
Steady Revenue Growth: Analysts forecast 5.8% revenue growth for FY 2025, driven by store expansion and strong discount retail performance in economic slowdowns.
EPS Projections: EPS is expected to grow by 8.2% next year, reflecting strong operational efficiency.
Defensive Industry Positioning: As a leading off-price retailer, Ross Stores thrives in economic uncertainty, attracting value-conscious consumers
Potential Paths to Profit:
Lowest Risk: Purchase shares directly and hold until the target price of $190 is reached.
Buy LEAPS Jan 2026 $160 calls (current premium ~$15) for long-term upside.
Bull Call Spread: Buy the $160 call and sell the $190 call for a cost-efficient play.
Covered Calls: Own the stock and sell $190 calls expiring in mid-2025 for income while waiting for appreciation.
Disclaimer: We are not a brokerage or investment firm. We do not offer financial advice or investment advice and/or signals. This is not certified financial education. We offer access to the daily thought process of an individual and his experiences. We do not offer refunds. All sales are final.

Rost falling?I can see ROST falling from here, the last upmove looked weak with low volume, also it looks like a false breakout which created some divergences. Maybe it will go back and touch the mean

Ross Stores: Pullback Near HighsRoss Stores rallied in the winter. Now, after a period of consolidation, some traders may see potential for further upside.
The first pattern on today’s chart is the pair of bullish gaps after the last two earnings reports. The first gap sent the retailer to new highs above its 2021 peak. The second reestablished it above its 50-day simple moving average (SMA).
The price jumps could reflect positive fundamentals. The move above the 50-day SMA may suggest the intermediate-term trend has gotten more bullish again. Also notice the latest pullback.
Next, ROST made a weekly low of $142.65 on June 11. Last week it tested and held that level. Has new support been established near old highs?
Third, higher weekly lows occurred along the 200-day SMA in May. That could suggest its longer-term trend is upward.
Last, stochastics have dipped to an oversold condition.
TradeStation has, for decades, advanced the trading industry, providing access to stocks, options and futures. See our Overview for more.
Past performance, whether actual or indicated by historical tests of strategies, is no guarantee of future performance or success. There is a possibility that you may sustain a loss equal to or greater than your entire investment regardless of which asset class you trade (equities, options or futures); therefore, you should not invest or risk money that you cannot afford to lose. Online trading is not suitable for all investors. View the document titled Characteristics and Risks of Standardized Options at www.TradeStation.com . Before trading any asset class, customers must read the relevant risk disclosure statements on www.TradeStation.com . System access and trade placement and execution may be delayed or fail due to market volatility and volume, quote delays, system and software errors, Internet traffic, outages and other factors.
Securities and futures trading is offered to self-directed customers by TradeStation Securities, Inc., a broker-dealer registered with the Securities and Exchange Commission and a futures commission merchant licensed with the Commodity Futures Trading Commission). TradeStation Securities is a member of the Financial Industry Regulatory Authority, the National Futures Association, and a number of exchanges.
TradeStation Securities, Inc. and TradeStation Technologies, Inc. are each wholly owned subsidiaries of TradeStation Group, Inc., both operating, and providing products and services, under the TradeStation brand and trademark. When applying for, or purchasing, accounts, subscriptions, products and services, it is important that you know which company you will be dealing with. Visit www.TradeStation.com for further important information explaining what this means.

Ross Stores Stock Jumps 8.34% on Earnings BeatRoss Stores ( NASDAQ:ROST ) has reported better-than-anticipated results and raised its guidance as it reduced costs. The off-price apparel and home goods retailer beat profit and sales forecasts, despite facing macroeconomic headwinds that squeezed its lower-income customers. CEO Barbara Rentler said the results came even as the company faced macroeconomic headwinds that squeezed their discretionary spending.
Ross Stores( NASDAQ:ROST ) reported first-quarter earnings per share (EPS) of $1.46, up from $1.09 a year ago, and revenue gained 8% from the year-ago quarter to $4.86 billion. Both exceeded forecasts. Same-store sales rose 3%. The improvement in profit stemmed primarily from reduced costs, as the company slashed expenses by $1 billion from the fourth quarter. Operating margin jumped 205 basis points to 12.2%, attributed mainly to lower distribution, incentive, and freight costs that were partially offset by the planned decline in merchandise margin.
Ross Stores ( NASDAQ:ROST ) CEO Barbara Rentler said that continued uncertainty in the macroeconomic and geopolitical environments, including inflationary pressures, "continue to squeeze our low-to-moderate income customers' purchasing power." She said the company would keep managing inventory and expenses "tightly" to maximize sales and earnings growth the rest of the year. Based on first-quarter results and forward guidance, Ross Stores boosted its full-year EPS outlook to a range of $5.79 to $5.98, up from the previous estimate of $5.64 to $5.89.
Ross Stores shares ( NASDAQ:ROST ) is up 8.3% at $142.72 as of the time of writing on Friday and have gained about 3% since the start of the year. The company's results echo that of its off-price peer TJX Cos, which posted better-than-expected first-quarter results and raised its annual profit forecast helped by easing costs and strong demand. With a Relative Strength Index (RSI) of 68.19, the stock is poised for further gains.

5/23/24 - $rost - a +ve EPS setup, but watching from parking lot5/23/24 - vrockstar - NASDAQ:ROST - a good play on affordability like NASDAQ:COST NYSE:BJ (which reported good #s in this AM) and then we even see semi-discretionary stuff that's still discretionary makeup ( NYSE:ELF ) doing fine. it's the pricey and let's wait category (or let's finance it category too) that are suffering the shoot-stock-first-figure-out-where-the-bottom-is-later. i'd post that 22x PE on this, positive growth, albeit MSD, and 4-5% fcf yield would probably be a "buy" all else equal in this tape. i'm not going to play this, similar to NYSE:DECK - same "vein" of thinking/ name here (though i prefer brands vs. sellers-of brands all else equal, even if the multiple is 50% more expensive). gl to the holders, will be rooting you on in this as well.

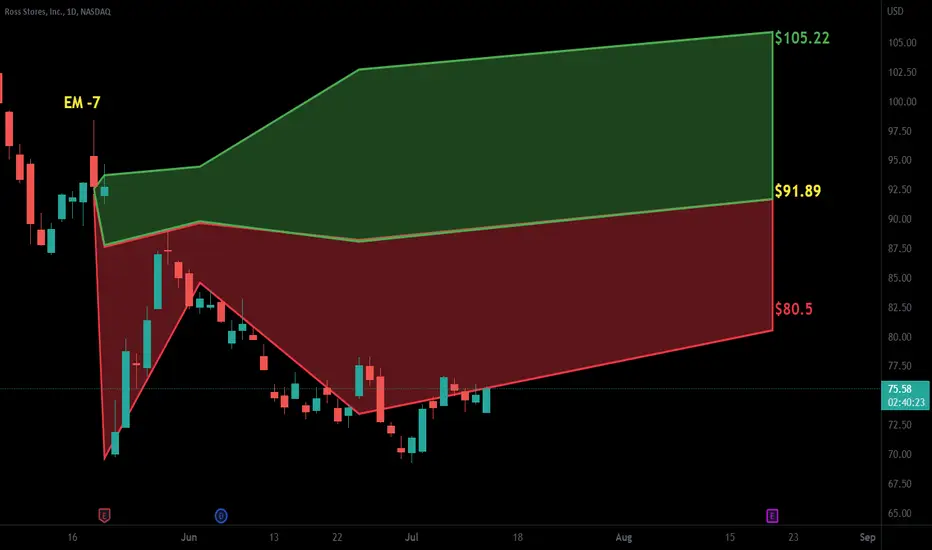
Intuition stock short ROST tgt $95I never had time this weekend to meditate and fish through time and space for a ticker, so while lying in bed I had the thought I should try to get something. Pretty immediately I "heard", "Ross dress for less." I'm assuming it's the stock and not a recommendation to shop cuz I actually hate my local store and refuse to go.
It seems like when these pop in super fast they're super good, though TXN is a bit slow atm.
The number that floated in was 14, so when I saw they closed Friday at $112.xx I decided this was for realz. Obviously it's at $114 today. I had my intuitive symbol for down float into mind, and sensed we're to expect down.
I didn't spend more time on it other than to dowse just now. The target I get is $95 and that it will be reached. I don't give a target any longer unless I get this verification as it's becoming pretty reliable. The "big idea" is a breakdown, so that validates my intuition. Whether I'm correct will be another matter!
Like other tickers/indexes I've inquired on today, there's an indication of going up into Thursday. NFP Friday could shake things up, but at this point, I'd be good shorting this late this week.
I'll update if there's anything sketchy when I check on it on Thursday. Not looking at much upside. Maybe to $118-19

$ROST Breaks Double Top Now What?NASDAQ:ROST Breaks Double Top Now What? Waiting for a pull back to (alert added) 122.70 and will take a small long position, a close below that price and I stop out on a weekly basis. Only way to manage a trade is to be in a trade.

Ross Stores to see a temporary move higher?Ross Stores - 30d expiry - We look to Sell at 112.85 (stop at 118.61)
Short term bias has turned negative.
We are trading at overbought extremes.
We have a Gap open at 18/11/2022 from 97.93 to 114.80.
Previous support at 113 now becomes resistance.
Preferred trade is to sell into rallies.
We look for a temporary move higher.
Our profit targets will be 98.51 and 96.51
Resistance: 105.50 / 107.50 / 110.15
Support: 101.00 / 99.00 / 94.50
Please be advised that the information presented on TradingView is provided to Vantage (‘Vantage Global Limited’, ‘we’) by a third-party provider (‘Signal Centre’). Please be reminded that you are solely responsible for the trading decisions on your account. There is a very high degree of risk involved in trading. Any information and/or content is intended entirely for research, educational and informational purposes only and does not constitute investment or consultation advice or investment strategy. The information is not tailored to the investment needs of any specific person and therefore does not involve a consideration of any of the investment objectives, financial situation or needs of any viewer that may receive it. Kindly also note that past performance is not a reliable indicator of future results. Actual results may differ materially from those anticipated in forward-looking or past performance statements. We assume no liability as to the accuracy or completeness of any of the information and/or content provided herein and the Company cannot be held responsible for any omission, mistake nor for any loss or damage including without limitation to any loss of profit which may arise from reliance on any information supplied by Signal Centre.

Ross stores breakout NASDAQ:ROST had formed a symmetrical triangle chart pattern. Waiting for a breakout.
This might be a great oppotunity to take trade.
If it takes breakout in upward direction then take long position.
first target $112.56
second target $116.58
If it take breakout in downward direction then take short position.
first target $97.97
second target $94.19
And stoploss is must.

Ross Stores to find resistance at previous support<Ross Stores - 30d expiry - We look to Sell at 112.85 (stop at 118.61)
Short term bias has turned negative.
We are trading at overbought extremes.
We have a Gap open at 18/11/2022 from 97.93 to 114.80.
Previous support at 113 now becomes resistance.
Preferred trade is to sell into rallies.
Our profit targets will be 98.51 and 96.51
Resistance: 107.50 / 110.15 / 113.00
Support: 105.10 / 98.50 / 94.50
Please be advised that the information presented on TradingView is provided to Vantage (‘Vantage Global Limited’, ‘we’) by a third-party provider (‘Signal Centre’). Please be reminded that you are solely responsible for the trading decisions on your account. There is a very high degree of risk involved in trading. Any information and/or content is intended entirely for research, educational and informational purposes only and does not constitute investment or consultation advice or investment strategy. The information is not tailored to the investment needs of any specific person and therefore does not involve a consideration of any of the investment objectives, financial situation or needs of any viewer that may receive it. Kindly also note that past performance is not a reliable indicator of future results. Actual results may differ materially from those anticipated in forward-looking or past performance statements. We assume no liability as to the accuracy or completeness of any of the information and/or content provided herein and the Company cannot be held responsible for any omission, mistake nor for any loss or damage including without limitation to any loss of profit which may arise from reliance on any information supplied by Signal Centre.

April Gainers (ROST, account up 0.5%)2nd gainer in April is NASDAQ:ROST .
Holding period is 5 days (3/29/23-4/3/23).
Account is up 0.5%.
Total return in April is 1%

Ross Stores to close it's gap?Ross Stores - 30d expiry - We look to Sell at 112.85 (stop at 118.61)
Short term bias has turned negative.
We are trading at overbought extremes.
We have a Gap open at 18/11/2022 from 97.93 to 114.80.
Previous support at 113 now becomes resistance.
50 1 day EMA is at 112.96.
Preferred trade is to sell into rallies.
Our profit targets will be 98.51 and 96.51
Resistance: 109.00 / 113.00 / 117.50
Support: 105.10 / 98.50 / 94.50
Please be advised that the information presented on TradingView is provided to Vantage (‘Vantage Global Limited’, ‘we’) by a third-party provider (‘Signal Centre’). Please be reminded that you are solely responsible for the trading decisions on your account. There is a very high degree of risk involved in trading. Any information and/or content is intended entirely for research, educational and informational purposes only and does not constitute investment or consultation advice or investment strategy. The information is not tailored to the investment needs of any specific person and therefore does not involve a consideration of any of the investment objectives, financial situation or needs of any viewer that may receive it. Kindly also note that past performance is not a reliable indicator of future results. Actual results may differ materially from those anticipated in forward-looking or past performance statements. We assume no liability as to the accuracy or completeness of any of the information and/or content provided herein and the Company cannot be held responsible for any omission, mistake nor for any loss or damage including without limitation to any loss of profit which may arise from reliance on any information supplied by Signal Centre.

ROST SELL ++++Ross stores is still in business? Ross is overbought and overextended $123 should be close the top of this leg before correcting and likely filling the gap back to $100 in coming weeks. If currently short I would suggest to ADD at $118, $120, $122


$ROST with a Bullish outlook following its earnings #Stocks The PEAD projected a Bullish outlook for $ROST after a Positive over reaction following its earnings release placing the stock in drift D with an expected accuracy of 66.67%.

Ross Downtrend Resistance BounceI believe Ross is going to turn down again based on a resistance line that has been in effect for more than several months now.

$ROST with a Neutral outlook following its earnings #Stocks The PEAD projected a Neutral outlook for $ROST after a Negative over reaction following its earnings release placing the stock in drift C with an expected accuracy of 75%.
Pullback at resistance 87 ROST is in a stage 4 downtrend with an extended climb since earnings report drop.
Looks like a good possible short for Friday considering the extended climb on Thu with a 5 USD void.

Ross Stores USA Sun Storm Investment Trading Desk & NexGen Wealth Management Service Present's: SSITD & NexGen Portfolio of the Week Series
Focus: Worldwide
By Sun Storm Investment Research & NexGen Wealth Management Service
A Profit & Solutions Strategy & Research
Trading | Investment | Stocks | ETF | Mutual Funds | Crypto | Bonds | Options | Dividend | Futures |
USA | Canada | UK | Germany | France | Italy | Rest of Europe | Mexico | India
Disclaimer: Sun Storm Investment and NexGen are not registered financial advisors, so please do your own research before trading & investing anything. This is information is for only research purposes not for actual trading & investing decision.
#debadipb #profitsolutions

Ross On WatchIm not usually into fundementals but I dont see how this stock is trading at anything over $40. I only see 20 stores on their website and theyre all located either within or in close proximity to Pennsylvania. Sure online ordering exists but there are so many other stores to choose from.
On watch for now
