Rackspace Technology inc RXT .1st wave completed 😎 2nd wave completed today ,
3rd Motive powerful wave starting 👌
Stock for Buy now .

Rackspace Technology inc ( weekly chart ) - NASDAQ: RXT -Stock reached rebound level , where a correction formed ABC zigzag correction, ww expected it as wave (B).
History correction looks like either a Flat correction big form , or it could be a combination double formation.
Target 1st price = 12 $ - 13 $ - combination double correction OR ,
Targe

Rackspace Technology Inc. | Chart & Forecast SummaryKey Indicators On Trade Set Up In General
1. Push Set Up
2. Range Set up
3. Break & Retest Set Up
Notes On Session
# Rackspace Technology Inc.
- Double Formation
* Range Structure)) | At 2.90 | Subdivision 1
* ((Neckline)) | Wave 3 Hypothesis
- Triple Formation
* ((Neckline)) | 012345 | Short Cont

Long RXT @2.396-oversoldThis one is one I'm excited about after crunching the numbers. I haven't traded it before but it has produced some eye watering paper numbers in backtesting.
Usual setup - oversold and keep adding until it isn't. Sell each lot as it becomes both overbought and profitable.
Here are the numbers fr

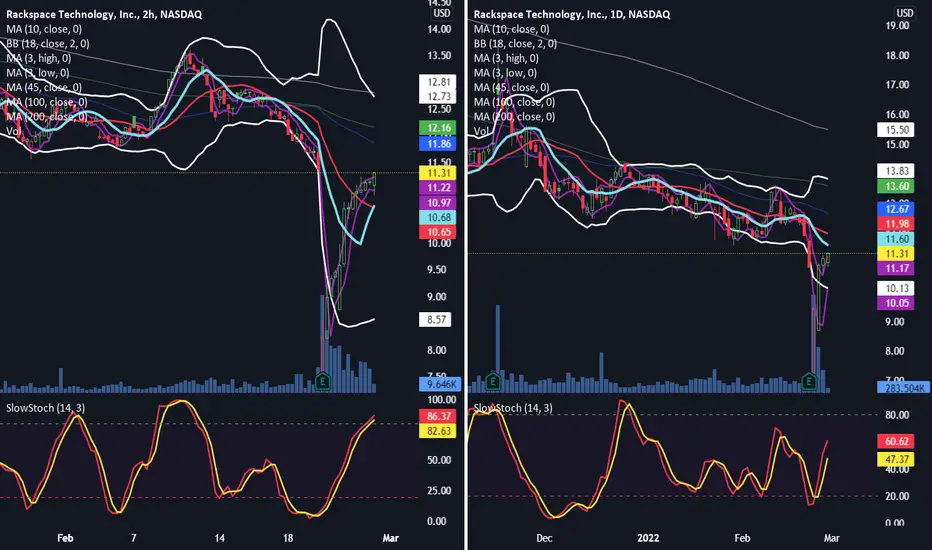
RXT - Short Term Target - 22%Looking for RXT to hit the Upper Bollinger Band.
Confirmation happened, can open trade.
Stop Loss $10.65.
Target Upper Bollinger Band (Currently $13.83) - Target will be dynamic.
By the way - this is not investment advice...
Scooping up some RXT near All Time LOWSLooks like this may have bottomed out at 13. MACD flipped to green, good volume, RSI showing oversold, almost 50% off 52 Week highs. I will take a swing here and scoop some cheap shares up.

Khan's Handelskontor - KW 39 - Swing Trade Idea 4 - $RXT5x Volume on last Friday than usual – Tutes wanted to pin this below $15 to win with their Puts
Close to 100% inst. Owned
Recent Cost efficent changes in cloud operations

Can Rackspace close the gap?RXT recently beat earnings but dropped over $2. With the RSI then dropping below 20, I am looking for it to bounce back and close the gap. The first PT is $15 with a full retracement PT of $17.5.

RXT Swing PlayIf support holds, should retest previous highs- $25+. Would wait for test of bottom support line and 100 EMA before entry.


See all ideas
Displays a symbol's price movements over previous years to identify recurring trends.