SIRI trade ideas
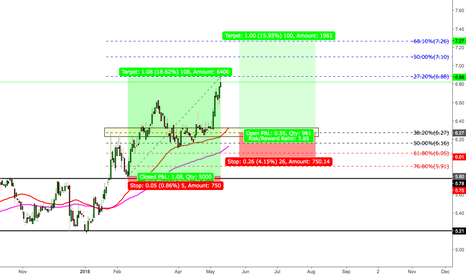
SIRI - SHORTWhat a run since the crash. Basically straight up for 10 years. SIRI is now hitting a former high ... I think it will find some rejection on the first attempt. RSI is cranked high on multiple time frames. Looking to dump soon. Market proxy stocks like AMZN NFLX APPL and FB plus the SPY will all influence.
SIRI break pattern breakout above 52w highs?SIRI has had some good times as of late and has built a nice bullish pole pattern with a nice upsloping 50 and 200 SMA. However, it has just rejected from it's (so far) 52w highs at 7.23 so I am cautious... I like to have a roof over my head you could say, with blue skies nobody really knows where the top could be!
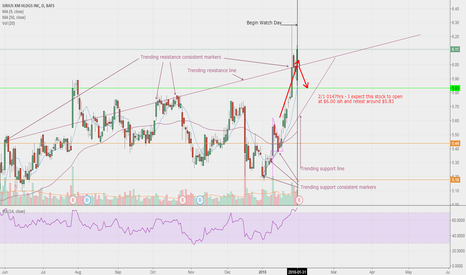
SIRI and a lesson in trend line chartingA nice flag setup 1/10 to 1/17 allowed this major bull move up and over the RSI Indicator past 70. Now it needs to retest and confirm its bull pricing. It may take several days to get to $5.83ish, as that is my solid support line in green. Alternatively, it may open sitting on top of trending resistance, thus making it a new support line and make another run. But i'm going with my original prediction lol
**Let's see what happens**
Drawing trending support and resistance lines allows you to really see where a stock is heading and what price points it wants to go. Add to that the RSI indicator (which tells you when the stock is overbought , or oversold ) and the volume chart and the picture gets clearer.
When drawing trending support and resistance lines, find commonality with several points (at least three) to draw from. If the points are drawn correctly, you will find more candlesticks near or touching your trend lines.
I am a new trader, i appreciate any feedback you have. Please help me if i need to update my thought process.
*Disclaimer- I am not a financial advisor. These are merely my opinions. Do your own research and formulate your own opinions regarding any moves you make. Seek professional assistance.
SIRIUS XM BULLISH FLAG/ FIBB RETRACEMENT THE FIRST GREEN CANDLE STICK BROKE OUT OF ITS RESISTANCE (SEE BULLISH FLAG). SEEMS TO ME THAT THIS STOCK MIGHT BE READY FOR ANOTHER RUN UP. THIS IDEA IS FURTHER BACKED BY THE FACT THAT THE GRAPH ALREADY BOUNCED OFF THE 50.0% FIBONACCI SUPPORT LEVEL AND IS HEADED TOWARDS MY TARGETED PROFIT AREAS OF 88.6%, 100.0%, AND 128.0%.
SIRI H&S PatternSiri has formed a head and shoulders pattern after a strong uptrend since it was $0.04 in February of 2009.
Some notes:
- Monthly indicators show the stock is well overbought and due for a pullback. Daily indicators show the stock is oversold after pulling back from $5.53 (52 week high). I would look for the stock to consolidate momentum near the neckline prior to pushing through.
- Monthly chart shows 2 fibonacci retracement points that the stock has used as support and resistance and could fall to should the stock break the H&S neckline. Moreover, on the daily chart, from $4.05 the right shoulder has used the 78.6% retrace as resistance, telling me that if the neckline breaks, our first point of resistance may be at $4.96 (61.8% retrace). (Yea, my brain hurts from all these fib numbers too)
- Volume is very telling here. Typically what you want to see in a H&S pattern is higher volume on the left shoulder, and possibly the head, with declining volume on the right shoulder's uptrend. Moreover, you'll notice that after the head formed (and frankly throughout the whole formation), negative days have shown higher volume than positive days.
- Monthly chart also shows a shooting star doji (without the shaved head). However, "technically", a shooting star doji should open lower, so don't read too much into that.
- On 3/22 the stock gapped lower and slowly covering the gap over the next few days before moving lower. No one likes a gap unfilled and this shows the stock is ready to move lower
SIRIPrice broke above BB and has now closed below. In addition to breaking BB, price has also settled below 20MA. Therefore, I have placed a 30 day put option (APR17) with expectation that price will reach the 200MA before expiry. However, I reserve the right to take profit at anytime before then.
Max risk is $78.49.
We Think $SIRI Has Some Sirius PotentialHonestly, I didn't even know Sirius XM was a publicly traded company until 6 months ago. Mainly because it's under $5, and I generally tend to avoid such stocks after getting burned in the penny stock world so many years ago. But SIRI is an interesting ticker, and one we recently acquired quite a sum of shares in for the long run, and by long run, I mean retirement.
We bought for multiple reasons, none of which revolve around Warren Buffet's company Berkshire Hathaway (BRK-A/B) increased stake in the company; although that can be a nice boost.
First, the company declared a quarterly dividend of $.01/share (.04/share/year). Granted, this is not a lucrative dividend amount by a long-shot, but it is one indicator of a fundamental shift in the company's long-term outlook to their business success. In essence, I like to see a company project confidence in their model by thereby rewarding their shareholders, even if it's a little. Oh, and that doesn't mean it won't grow in the future either.
Second it's maintained a nice technical uptrend, so we're at least going to ride it for a bit of the long haul. We've had two entries hit since the stock really started running.
Third, we don't like to speculate on the future of a company's capabilities or markets, but due to our knowledge of satellites, I find it interesting that SIRI is named as a potential contender in the "Connected Car". The possibilities of Sirius's S-band downlink being used as a secondary or tertiary backup link, or a data stream to the cars' ability to predict traffic and best routes possibly could be a market entry when the self-driving car technology gains a foothold. This would allow for contractual growth and a steadily grown curve of revenue.
For just a minute though, let's get a little crazier and speculate a little bit. Another interesting concept is Sirius' versatility and the company's placement's potential for scale. In reality, Sirius is a Satellite communications provider; it's just a one-way transmission to your car radio. But here's food for thought: satellite phone communications. At the moment, most sat phones are not even worth the average consumer buying due to the high cost of operation ($6/minute) and the infeasibility of carrying a brief case that holds the equipment. But when we looked at SIRI, we look at how other companies might be looking to scale, and how SIRI might do the same. We personally think that there's only so many cell towers one can build, and they only provide coverage in a certain area. Furthermore, the current satellite phone providers such as Iridium, Globalstar, and INMARSAT have a huge cost, and rightly so due to the amount of satellites they've put in orbit to maintain their service provision. But I think Sirius is a well-known consumer brand. Seriously. Ask any person on the street what it is and they'll likely tell you it's a satellite radio. Now tell that same person that Sirius is providing phone services to their iPhone/Android/Pixel. They probably wouldn't be very surprised would they? But how would SIRI do it? Possibly through a joint venture with a company like Google or Android since Apple is a competitor in the online music streaming business. If Google (NASDAQ:GOOG) were to come in, design a proprietary receiver/transmitter into the phone it'd be a win-win for both companies. Also, SIRI would be that service provider undercutting the competition SATCOM providers as well as terrestrial providers like Verizon (NYSE:VZ), T-Mobile (NASDAQ:TMUS) and AT&T (NYSE:T). Thus, Sirius would have then successfully expanded and would gain an insurmountable competitive advantage.
The transmission architecture could possibly be supported both through uplink communications to a leased COMSAT (cheaper than building a new one) or through the joint venture to build an entire new constellation. Not to mention, Sirius already has a terrestrial repeater network for their radio services (much like cell towers), and this could have a


