🟢 $SNDL Target 1.95 for 65.25% ADDED to $SNDL NEW Target 1.95 for 65.25%
Or double position again at .41
This one has been a drain but it will have it's day... I doubled my position here (a little bit more than doubled...)
—
On the far right of the chart is my Average (Grey) Current Target (Green), and Next Level to add (Red) Percentage to target is from my average.
I start every position with 1% of my account and build from there as needed and as possible.
I am not your financial advisor. Watch my setups first before you jump in… My trade set ups work very well and they are for my personal reference and if you decide to trade them you do so at your own risk. I will gladly answer questions to the best of my knowledge but ultimately the risk is on you. I will update targets as needed.
GL and happy trading.
I finally added my YouTube Training Video to my profile tagline since I’m not allowed to on here. It’s a quick 15 minute training video on how to set up your chart and how to spot opportunities. So check here first but If you have questions just message me.
SNDL trade ideas

the final target of $SNDL is $20 the final target of $SNDL is $20 but it will have negative reaction at $5 and $10.
shark harmonic pattern:
AB=0.38 XA
BC=1.6 AB
tp1=1.6 BC=0.88 XA=$5
tp2=1.13 XA=$10
tp3=2.24 BC=$20

Fractal Analysis Shows We Still Valid! (Fortune Fractal Pt. 4)I had some people asking me to make an update post on SNDL's current situation. As usual I am going to approach this from a fractal analysis (FA) perspective and I'd like to say that the "Fortune Fractal" Strategy is still valid!
Looking at the chart, I drew out what appears to be another smaller bull pennant that formed after the larger one from earlier this month. This smaller bull pennant has similar characteristics with the larger bull pennant right before it. It also still follows the general rules of the Fortune Fractal strategy. Here are few things to consider:
1.) Just like the larger bull pennant, the smaller pennant shoots above the SMMA 7 line before slowly retreating back below it. This is what I consider to be a retesting of price action before an fractal explosion could potential happen.
2.) Similar to the larger bull pennant which bounced on the pink line within the RSI, the smaller pennant looks like it will soon do the same thing. If we can get a bounce of price action around the pink RSI line, then we can place more faith in the Fortune Fractal.
3.) Lastly, the MACD seems to be showing signs of decreasing bear influence on the stock as the red bars on the histogram have become lighter and smaller than its preceding bars. If we can see a confirmed shift to green bars on the MACD (showing bull influence), I think we can put even more confidence in the Fortune Fractal.
***I am not a financial adviser in anyway, I just enjoy Fractal Analysis and find it very reliable in this situation. That being said, I expect everyone to do their own Due Diligence instead of following blindly.


Hidden bullish DIVPretty obvious hidden bullish div with higher lows developing. Chart is self explanatory with SL & TP plotted. Do you're own research but I, myself, will be stocking up on $1 2022 call options before this moons. Let me know your opinion down below!

SNDL BULLRUN IMMENANT Do you all realize what we have done? we bought their naked calls. WSB is now turning eyes directly toward SNDL now that AMC is pumped, it IS the next target.
Prepare. 1$ strike calls would print 10s of 1000s

Is it finally happening again? ("SNDL Fortune Fractal" Part #3)Everything has lead up to this point , the Technical Analysis (TA) and the Fractal Analysis (FA) have both played out exceptionally well and have lead to this moment of truth. By the end of this week, if everything continues to go as expected, we could be seeing the explosion of the fourth SNDL Fortune Fractal ( coined by yours truly :D ).
Let's go over what's happened:
1.) In the early stages we saw the price action firmly broke above the SMMA 7 line (refer to the bold purple circle on the chart) and we are currently seeing a retesting of price action at/around the SMMA 7 line .
2.) We have witnessed the predicted bounce of price action on the pink line within the RSI (refer to part #2). The bounce is depicted by the golden circle.
3.) As of the end of today, the MACD is showing signs of a reversal . The bear momentum is shown to be decreasing on the histogram and the blue line is about to cross the orange line (see chart).
4.) There are bull indicators everywhere! On the chart provided, we can witness a dramatic breakout to the upside from the bull pennant . Also, there is a flat-top bull pennant on the 10m chart , indicating increasing bull influence in the price action.
5.) We saw very healthy volume today. If we continue to see this amount of volume, I won't be surprised if the stock skyrockets even higher.
What to Expect/Look Out For:
I will be watching for the break of the bull pennant on the 10m chart, and additionally watch for a full reversal on the MACD (see the golden circle on the MACD). After that, I will refer to Step #3 of my Fortune Fractal Strategy for my exit signal and wait for the RSI to hit overbought.
---------------------------------------
"We've been to the moon three times before, it's time to go back once again."
~Capt. Moki
---------------------------------------
Disclaimer : To fully understand the basis of this post, I would suggest reading parts 1 and 2 of the 'SNDL Fortune Fractal" which can be found on my profile.
' Disclaimer : I am NOT A FINANCIAL ADVISOR NOR A FORTUNE TELLER! I expect all traders to do their own DD and trade according to their personal style and beliefs.


The HANDLE is DONE!!!!As you can see it is now sitting on both support; DSI support box:
Now it has to come up and as per webull PIE chart; 94% are APES who is holding.. shorties are out..
NOW WE ARE EATING!!!
CUP AND HANDLE COMPLETE!!!
MOON TIME BABY!!!


SNDL Harmonics: Let's Ride!So. I expect price to bounce at 0.75-0.74 but I put a range of price in here anyway, from 0.81-0.74. I expect this price to be the lowest SNDL goes for the foreseeable future, eventually heading to 11-12 dollars in the long-term. e.g. 1-2 years. Anyway. Good luck, trade safely, and let's make that money with the REAL reversal zones! Please see below for the bigger picture.

$SNDL 50 EMA good for a pop$SNDL daily hammer candle on the 50 day EMA has been good for at least a dead cat bounce, since $SNDL is coming off a bottom and not a parabolic move, I expect more than a dead cat bounce here

SNDL 160%I'm sure that everyone and his brother is aware of this one by now, but just in case you aren't...After almost 3 months of decline, SNDL has broken out and is heading back down for a retest. Vertical blue lines show targets of the major and minor descending wedges. RSI is above 50 on both the daily and weekly scales. Weekly MACD is preparing to cross over in positive territory. Buy price is $0.95. Sell price is $2.49 (160%). ITS YOUR MONEY, DYOR!!!

Elliot Wave TheoryI believe we are nearing a breakout. Seems more like a Zig Zag but could be an Ascending Impulse.


SNDL is About to Pop! (Fortune Fractal Part #2)***If you haven't read the first post, I would suggest reading that first part to get the full context of what I am about to talk about (check my profile).
We are currently in the second step of what I coined the "Fortune Fractal" Pattern. The price action is around the SMMA 7 line, and it won't be long before a massive move to the upside could happen. I am just waiting for the full retest at the SMMA 7 line. I listed a few of my additional thoughts on what to consider if you plan to enter this trade:
1.) The current price action on the day-chart is showing a beautiful bull flag . These are usually a good indication of a potential move to the upside once the price moves above the flag (of consolidation).
2.) Previous fractals seem to bounce around the pink line on the RSI (around 45.90) and after that the price shoots into the overbought region.
3.) The blue line seems to dip below the yellow line on the MACD slightly before the move to the upside. Additionally, there is sometimes a small red slope on the histogram before it reverses to green.
Keeping all of these factors in mind, I can see a green SNDL explosion very soon if everything plays out right (personally, the set up with the price action couldn't get any better).
***Please remember that I am NOT A FINANCIAL ADVISOR, this is simply my way of analyzing the SNDL stock using fractal analysis. Do your own Due Diligence!


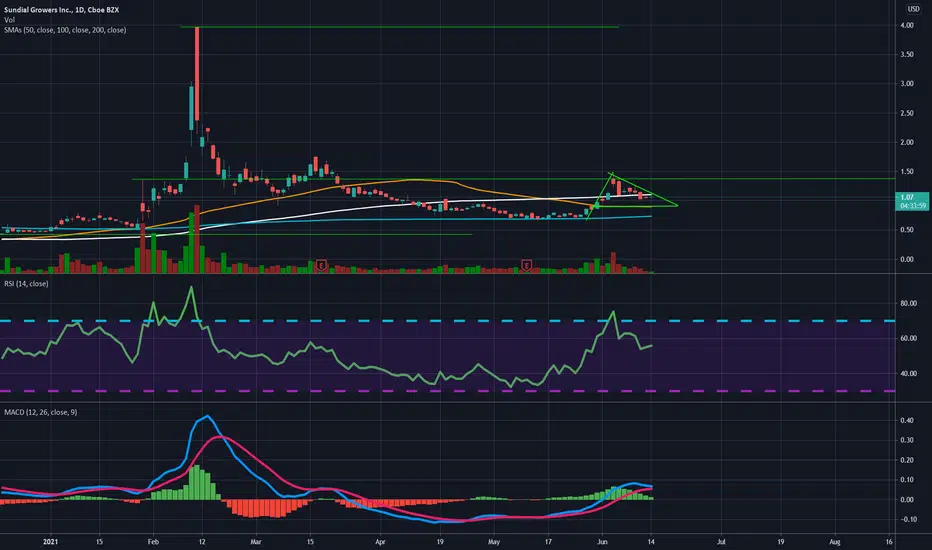
Watching SNDL. Watching SNDL as i was looking at the daily chart and it seems like it is in the process of a bullish pennant. So far it looks like it is playing out, and if it does i am putting a 2 dollar target on this for a swing trade. Will watch closely as this stock has been very volatile and the MACD is closing green while the RSI is steady.

BULLISH: Sundial Growers $SNDL CUP AND HANDLE formationSundial Growers , which is one of the volume leaders in the market each day and one of the most owned stocks by retail investors on trading apps like Robinhood is forming the handle of a BULLISH Cup and Handle formation.
In addition to being on an uptrend and consolidating at the $1+ level , the stock is also seen as undervalued given that it only trades at 2x tangible book value compared to 12x tangible book value at other cannabis stocks like $CGC and $ACB . The interest in call options for the stock are trending quite bullish and they imply that traders are expecting a run up similar to the one seen by the stock in February, 2021. NASDAQ:SNDL
Here are some bullet points on the stock which has seen a sudden influx of buy-ins from hedge funds and institutional investors this quarter.
