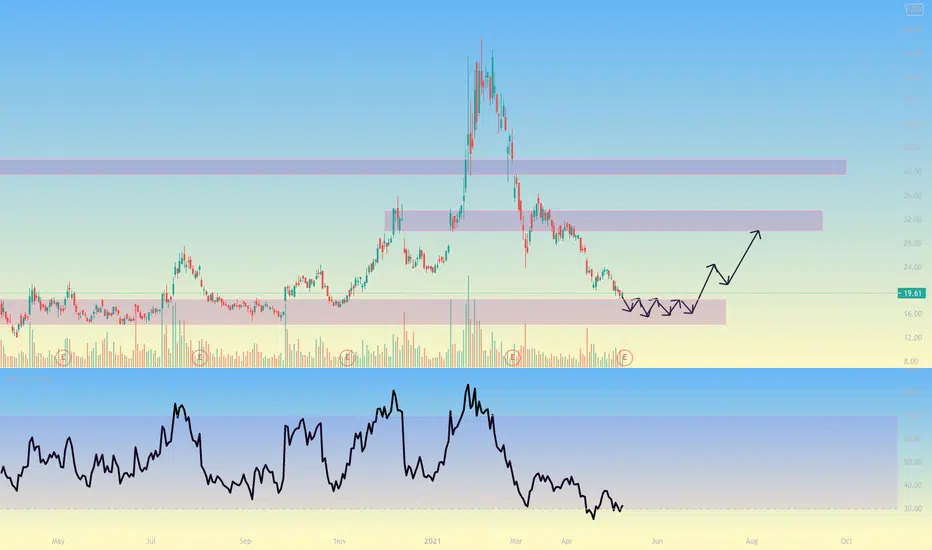
$SPCE Bullish signal Positive Divergence RSI targeting 26.8Formed nice bullish pattern with RSI positive divergence and with low money flow index. Possible entry for short term bounce to 26.8-27 levels then consolidated or rejected - current at 19.6 so around 20% move. if current wedge is broken down then 16 its more likely to be visited!
SPCE trade ideas

When Will The Tide Turn For Virgin Galactic (NYSE: $SPCE)?!? 🌊Virgin Galactic Holdings, Inc. is a vertically integrated aerospace and space travel company, pioneering human spaceflight for private individuals and researchers, as well as a manufacturer of advanced air and space vehicles. It is developing a spaceflight system designed to offer customers a unique and transformative experience.

SPCE looking juicy SPCE dip entries almost here in my opinion, 16-18 area would be where id consider adding some shares for a swing to 30-40 area, can set a stop loss at 14, the risk reward is getting good here! goodluck longs <3

VIRGIN GALACTIC will rocket fly?
As we can see, since February 2021, VIRGIN GALACTIC stocks only fall and it looks like this fall will be up to the global support line of $ 14. If VIRGIN GALACTIC does not announce the successful launch of its rocket, most likely the price will continue to fall and break through the support line. But, if VIRGIN GALACTIC announces the successful launch of its rocket and all goes well, the price will skyrocket and it will be a real ROCKET.
If you like the idea, subscribe and like it.
Good luck and big profits.

ADDED to $SPCE New Target 41.10 for 38.38% $SPCE Target 41.10 for 38.38%
Or next add level is at 18.30
Look at how beautiful that chart is starting to look!! GL
—
On the far right of the chart is my Average (Grey) Current Target (Green), and Next Level to add (Red) Percentage to target is from my average.
I start every position with 1% of my account and build from there as needed and as possible.
I am not your financial advisor. Watch my setups first before you jump in… My trade set ups work very well and they are for my personal reference and if you decide to trade them you do so at your own risk. I will gladly answer questions to the best of my knowledge but ultimately the risk is on you. I will update targets as needed.
GL and happy trading.

Traditional|SPCE|LongLong SPCE
Activation of the transaction only when the blue zone is fixed/broken.
The author recommends the use of anchoring fixed the blue zone, this variation is less risky.
If there is increased volatility in the market and the price is held for more than 2-3 minutes behind the activation zone after the breakdown, then the activation of the idea occurs at the prices behind the activation zone.
The idea is to work out the resistance level .
* Possible closing of a trade before reaching the take/stop zone. The author can close the deal for subjective reasons, this does not completely cancel the idea and is not a call to the same action, you can continue working out the idea according to your data, but without the support of the author.
+ Maybe right now we will go even lower, then it's okay, the idea is not activated and simply canceled.
+ ! - zone highlighted by the ellipse is a zone of increased resistance, in this area there is a possible reversal for a correction, please take this factor into account in this transaction.
The "forecast" tool is used for more noticeable display of % (for the place of the usual % scale) of the price change, I do not put the date and time of the transaction, only %.
Blue zones - activation zones.
Green zones - take zones.
Red zone - stop zone.
Working out the stop when the price returns to the level after activation + fixing in the red zone.
Orange arrow - the direction of take.
The red arrow - the direction of the stop.
SUM PNL: This parameter displays the total % of all closed ideas of the "new" format (according to the author) for this sector at the time of publication of the idea. The calculation is very "clumsy" just the sum of the profits of all the ideas, based on this indicator, you can more accurately assess the risks when working with my ideas of this sector. I present you the construction of the idea, you can use it yourself as you like based on your subjective view and risks, the calculation of the PNL indicator is carried out only on transactions that the author closed on TV in manual mode or by take.
P.S Please use RM (risk management) and MM (money management) if you decide to use my ideas, there will always be unprofitable ideas, this will definitely happen, the goal of the system is that there will be more profitable ideas at a distance.


SPCE: Will this support level break down?SPCE is right at a major support line within it's uptrend channel with an oversold RSI . Last couple time we experienced these conditions, SPCE bounced back up nicely. So I think, it's less likely for it to break below 20, and should go for a juicy upward movement for the next month or so. Fibonacci extension at 50% is right where we saw a large gap on Feb 26th that needs to be filled at some point making the green box a probable target. The bottom yellow line is absolutely crucial though. It should not be broken down or our next target would be 17, 14, and who knows maybe 9?
There is always a chance of going sideways but since the earnings are coming up soon, I don't see that play out for now but let's see.

FINALLY!! News on Space Launch Test this month and more!!!FINALLY we have some hint of the flight this month!! Also "Blue Origin" to announce ticket prices tomorrow and leaks that it is North of 500K vs 250K on Virgin Galactic. That is good news!! They both carry 6 total, but a lot more training is required for Blue Origin due to being your typical rocket. Virgin has 600 tickets reserved. It is just a matter of time. Virgin said the other day that they are already back in the air preparing for the next space launch test.
And this is is todays news out just 21 minutes ago!! :)
twitter.com
Virgin Galactic
"Today's view from our mothership #VMSEve, as preparations for SpaceShipTwo Unity’s next test flight continue. Eve is uniquely designed to carry our spaceship to approx. 50,000 ft, where our pilots release it and ignite the rocket motor for the final 60-second flight into space."

Bought SPCE @ $20 Per Share- 66% drop in price
- Trent line
- Key level of support
- Buy low, sell high

Buy $SPCE - NRPicks 30 AbrVirgin Galactic Holdings, Inc. is an aerospace company that develops space flights for individuals and researchers in the United States. It also manufactures air and space vehicles. The company's operations include commercial flights, research and development payloads in space.
SPCE is a very volatile and speculative company that is coming off a setback since February of approximately 67%. The strategy pursues a report of results from fair to good and a rotation in the market towards this type of companies.
- RSI oversold
- 12% below MA50

ADDED to $SPCE New Target 41.48 for 30.07% $SPCE Target 41.48 for 30.07%
Or next add level is at (anywhere around here is a great add.
—
On the far right of the chart is my Average (Grey) Current Target (Green), and Next Level to add (Red) Percentage to target is from my average.
I start every position with 1% of my account and build from there as needed and as possible.
I am not your financial advisor. Watch my setups first before you jump in… My trade set ups work very well and they are for my personal reference and if you decide to trade them you do so at your own risk. I will gladly answer questions to the best of my knowledge but ultimately the risk is on you. I will update targets as needed.
GL and happy trading.


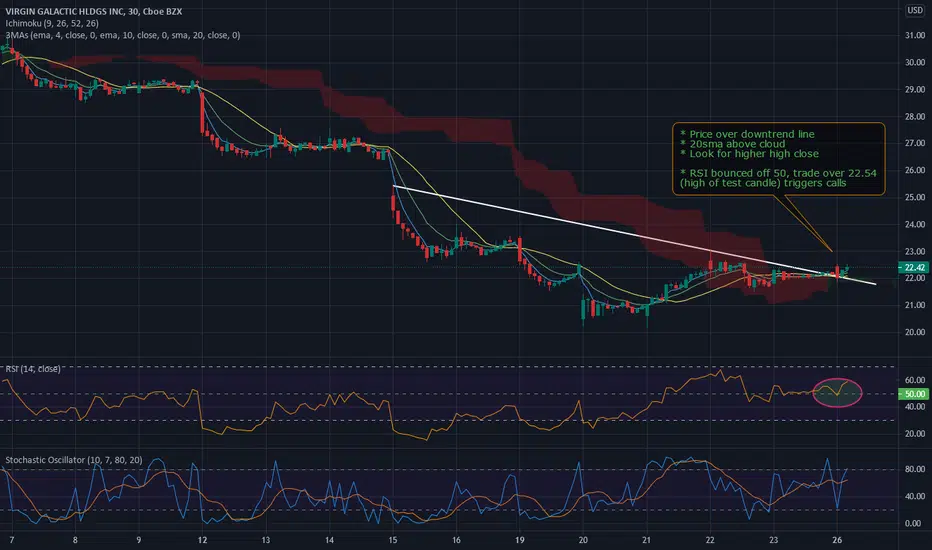
SPCE - moving higher - swing calls - low riskRead chart notes. After a long move down price may be ready to move up again.
Looking for 30m candle close over 22.60 to create a higher high close.
Multiple stop losses can be set: below 22.30, below 22.10, and option percent down.
[SPCE] Great Value Earnings & Next Flight Swing PlayAt fantastic value ahead of two big May events earnings and (possibly) first successful flight, look out as Price starts breaking up through each fractal for increasingly confident confirmation.
OG Idea


SPCE PlanSPCE formed a very obvious head and shoulders pattern with a clear close below the neckline. At this moment, a red hollow candle has formed, indicating a bounce is near.
Given that RSI is oversold, I expect the bounce to happen tomorrow. If the neckline is retested and price is still closed below, then that would signal the time to reload on puts.

Watching closely for solid support for next up trendWaiting for SPCE to establish solid support. If current price can't hold 14$ range is probably where we can buy. Pt 40$ Long.
