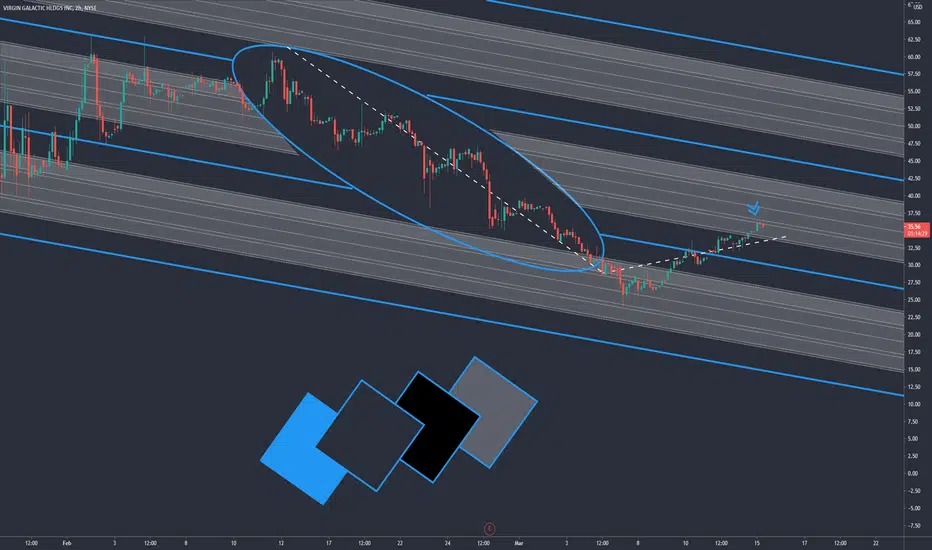
$33+ Price target for April 1 2020, and how to play itYou could argue that the cup and handle semi-formed in the early hours of Thursday, March 25 - and if so, it is time to look forward to a bright future with Virgin.
At apx 11:00 EST Thursday, March 25, the 20 SMA crossed back over the 50 SMA on the 5-minute intraday chart, giving a strong BUY signal, and the charts/markets obeyed.
How do we play this? Look to positive reactions to SS3 release, ARKX rumors, and a future May Launch.
WARNING. SPACEX may have had a failed launch the early morning of Friday March 26, and while $SPCE is NOT SPACEX, there is a magical tie between the two and price action. You may want to time your entries after the market reacts ( buy the dip if there is one). Best case, it cools off $SPCE just enough to find a nice discount.
What play I'll look to get into:
Let's play the SS3 with 1 APR 21 $30 Strike Calls, paying less than $1.25 if possible. Use the gains and let it roll into another call (TBD) for post-launch after May.
SPCE trade ideas

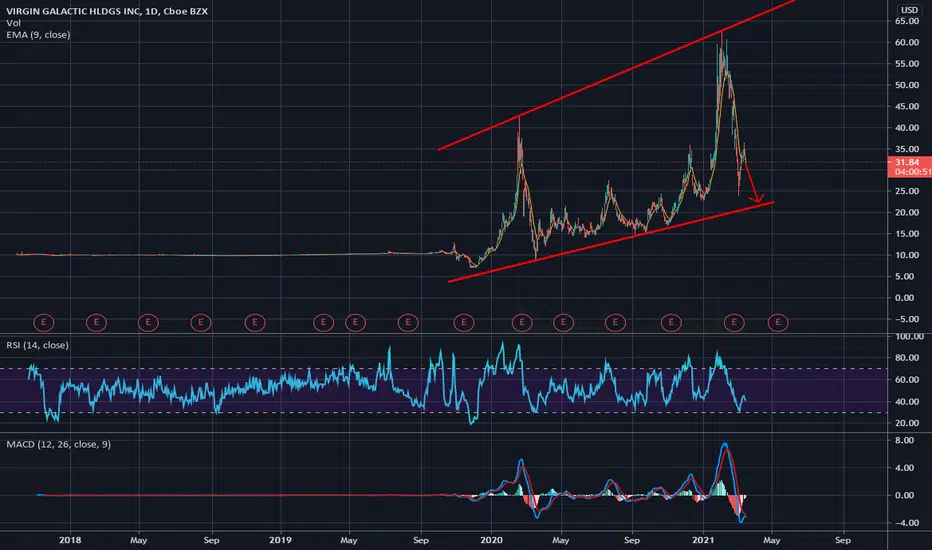
🚀Blast off VirginGalactic 300+ % to the upsideBy following the monthly support/resistance lines we get a general indication of where this stock may go in the near future, approx 2yrs. As the acceptance of commercial/tourist space travel continues to grow it gives my thought/idea a bit more confidence.

$SPCE - VIRGIN GALACTIC // LONG 3/21$SPCE is testing 0.618FIB level, 100 EMA & support trendline. Currently oversold.
Stop-loss and targets are given in the chart.

Be SafePossibly in a head and shoulders formation. If there is no move up soon, it could very well be a H&S pattern.
Perhaps the support of the neckline will hold. Pattern is not valid unless neckline is broken in a downtrend.
No recommendation. This is a tall structure so be safe.

SPCEDue to the bad news of the company we have seen a downward cycle, remember that the market sentiment indicates the Elliot cycle but the news is what we rescued from a strong fall, we have two golden areas, although we must wait for the breakdown of the shoulder head shoulder, at the moment I see it bearish.

Is this the bottom? Dear Traders,
Last time I posted on SPCE, I mentioned that the price is going through a correction following Elliot 4th wave and today we can see we have hit the bottom of wave with a strong price rejection at 38.40 near 50 MA. This could be a confirmation that we are at the bottom of the wave and should start wave 5 tomorrow but we might get even closer to 50MA before we go back up. As you may know, if we touch 35.40, then this is not an Elliot wave and this predication shall be dismissed. However, if we reverse this downward trend before hitting the redline, the 5th wave should start to form and we should see 70 around late March.
Of course, market does whatever it likes and these prediction might not mean anything but should give us a clue while we keep an eye out for SPCE price action. Also this is not a financial advice and I'm not a financial expert.
If you enjoy this analysis please give me a thumbs up and leave a comment. This will motivate me to keep going!
Thank you
AH

SPCE Zone of Buy InterestThis trendline has had a lot of touches, and I'm looking to add here for my long term hold. No stop loss, I really think space flight is going to be a bustling industry, if only to take humans to space to show them the magnificence of the earth so they choose to take better care of it.

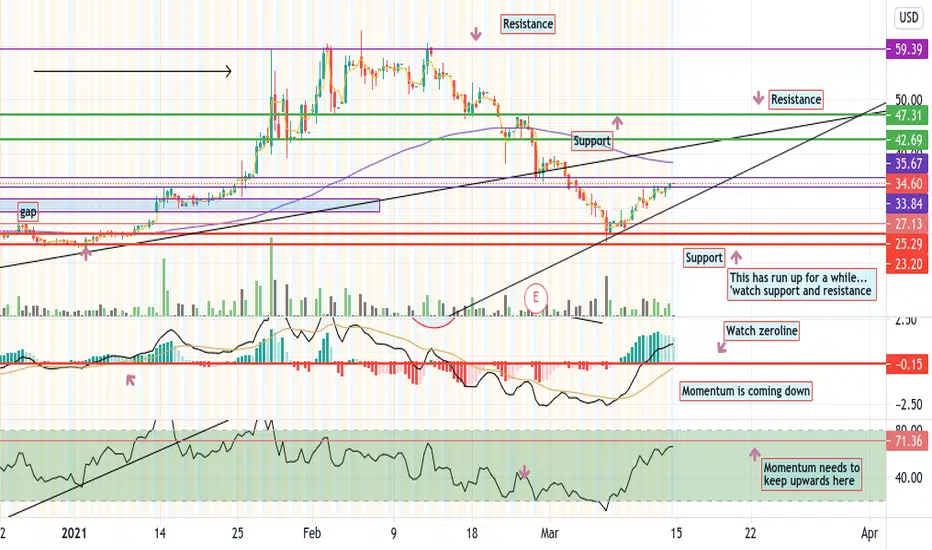
Looking to complete the Inverse Cup and Handle formation by EOWLooking for a dip this week with JPOW's week of talks, interviews, and another week of no news from Virgin Galactic PR. If this inverse cup and handle is going to complete this week, I see it touching $26 and fast. Even with a possible slight push up from "dumb money" on Monday morning, the sooner it touches $26 this week, the sooner we have a chance for it to hit $24 and below before reacting to Spaceship 3 news next Thursday 3/31/21.
The unveiling of SS3 will not be a portfolio saver, $SPCE as a company has lots to prove. If Virgin announces an official launch window target, that should be enough to take this ticker from the ground and back toward $55 by the end of May assuming no further delays and a successful test flight.
Regardless if $SPCE hits any sub $30 number this week, all profits from any short positions should be invested into a long strategy such as Jan 21 22 $125 strike calls with profit-taking/adjustment around post-test flight 6/1/21~8/31/21, and I'll be looking for $65-75 underlying targets with consideration to hold if there is any indication of this hitting $100/share.

Buy $SPCE - NRPicks 07 Mar
Virgin Galactic Holdings, Inc. is an integrated aerospace company, developing human spaceflight for individuals and researchers in the United States. It also manufactures aerial and space vehicles. The company's spacecraft operations include commercial human spaceflight, commercial flight research, and space development payloads.
The company came close to losing all its 2021 profits in the last few weeks, attributed to the overall market decline and to investor Chamath Palihapitiya making official a sale of 6.2M of Virgin shares. Possible sustainable rebound in MA200
Technical:
MACD Level (12, 26) 5.76
Bounce over MA200
Price below MA50
RSI 36.02 Oversold

SPCEMID-TERM: 4hr hidden bullish divergence with a hammer off of support and 200 day MA. Also oversold on RSI. (not financial advice)


Double BottomPossible stop below first bottom. The market has had some really rotten days, so be safe.
Not a recommendation.
Technical analysis does not predict the future, it tracks the past, and any pattern, support level or indicator can fail. You have to use your own judgemnt to decide what traders will do in the future, by looking at what they did in the past.

SPCE - .35 RES In a consolidation channel. When a stock like SPCE starts to get going we will know that MOMO is back in the market.

Virgin Galactic right in the buy zone...Price has serious volatility, but right now it is very close to the 200 day moving average. This is a great zone to average buys for your investment holdings or to enter mid-long term trade.


SPCE completing Right shoulder ?I think with the pressure on growth stock we could see this in low 20's

Interesting around 20If it reaches 20 levels i'm selling some puts on this stock willing to get assigned.
SPCE 🌦Pattern recognized: Running flat Elliot Correction Wave.
Thesis: Bullish sentiment.
Conclusion: Looking for fractal on the 5 min.
My strategy: MEWT (MODIFIED ELLIOT WAVE THEORY).
***This does not constitute financial advice.***

SPCE Round DownSPCE looks like its is forming a rounding down formation as it creates the second shoulder, in a long term head and shoulders pattern. The neckline looks to be at 26.5 which will act as support. I will play this to that level, as it may take multiple tests to breakdown from there.

ABC Bullish Double Bottom The 2 bottoms are fairly close in price, they do not have to be identical and rarely are. Double bottoms have a neckline of sorts like an inverse head and shoulders. Long entry level is at neckline.
Negative Volume is low on this one. It looks like smart money got in this one at the very bottom of 9 to 14 dollars. Positive volume and obv is high.
Not a recommendation

SPCE going to the moon (pun intended)failed breakout but held support, might see round 2. need to start closing above green wedge
