AT&T Looking good for bullsBlue: Horizontal Resistance
Light Blue: Trend Line Resistance
Yellow: Support(s)
From my analysis of "T", I have found that it will be good for a long strategy. If at April Nineteenth It breaks the resistance and/or support and goes either way, It will hit either my first support (in purple). From my analysis on a grander scale, (3M, 6M), it most likely will not break that support. In regards to breaking the resistance (in orange), that is more likely. From todays performance alone (almost reaching the 32.00 resistance by one cent), it will break that resistance (in orange) in around the one o'clock to five o'clock mark.
Thanks for reading. I am a beginner and don't even know if this anything near correct. Feedback welcome!
White circles are markings for other timeframes.
image]https://www.tradingview.com/x/hIZoH0qG/
T trade ideas

Had and Shoulders pattern broken on #T #AT&T #stockToday's big green candle clearly marks the break of the Head and Shoulders' pattern neckline at the $31.50 mark.
Factors confluence also calls for EMA200 break at the same level (not shown in this chart). Target from here on is $36.

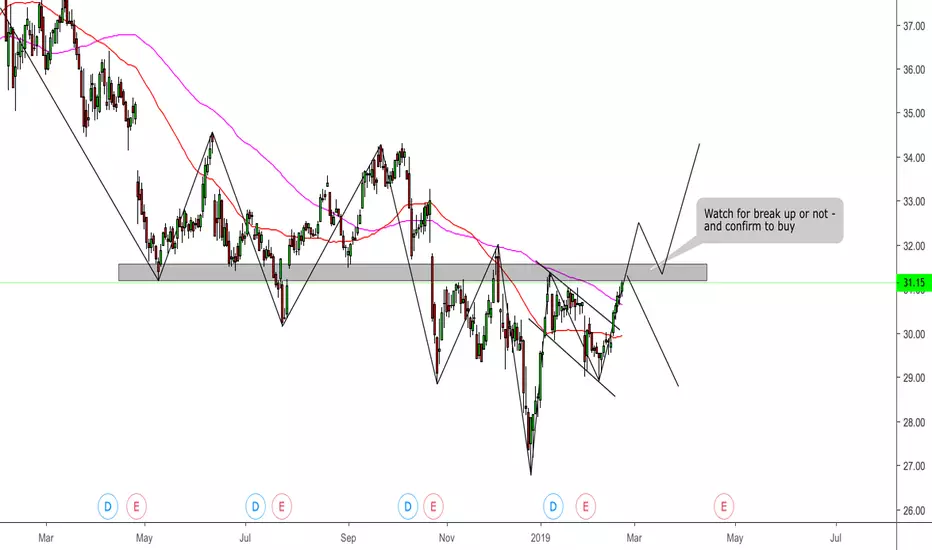
Complex Inverse Head & Shoulders on AT&T. Could look to rally.AT&T (T) is testing the neckline of this complex inverse h&s pattern, which also coincides with the 200 day moving average. If the price can break up from here, we could see T rally to $34-36.10. Personally, I want to see a break-out and retest of the neckline and 200 day moving average as new support (confirming that old resistance did in fact became new support) to give us better confirmation that this stock wants to move higher.
Moving average guide (All daily for this post):
50 day moving average in Green.
100 day moving average in Yellow.
200 day moving average in Red.
Entry: Along the neckline and 200 day moving average around $31.15-$31.30 IF it breaks out (as mentioned, I want to see these levels broken and held as new support for a bit before entering.)
Target 1: $34.30 (Prior resistance zone.)
Target 2: $36.10 (Prior consolidation zone and the estimated measured move of the complex inverse h&s break-out.)
SL: $30.10 (below the 50 and 100 day moving averages.)
-This is not financial advice. Always do your own research and own due-diligence before investing and trading, as for investing and trading comes with high amounts of risk. I am not liable for any incurred losses or financial distress.

Ascending Triangle with 6% upside and 6.5% yield as bonus$T is a great 5G and streaming content buy under $32 with an ascending triangle reaching near breakout. A near-term 6% upside to first resistance at $36 and a 6.5% dividend yield as a bonus makes this a great play.

T Ascending triangle patternLook for AT&T to breakout of the ascending triangle as sellers are being pushed out. You have a 6.62% dividend yield as a safety net.


Looking for entry into AT&TWaiting for trend line breach for long position. Or bounce off lower support. Does 6% dividend provide a margin for error?

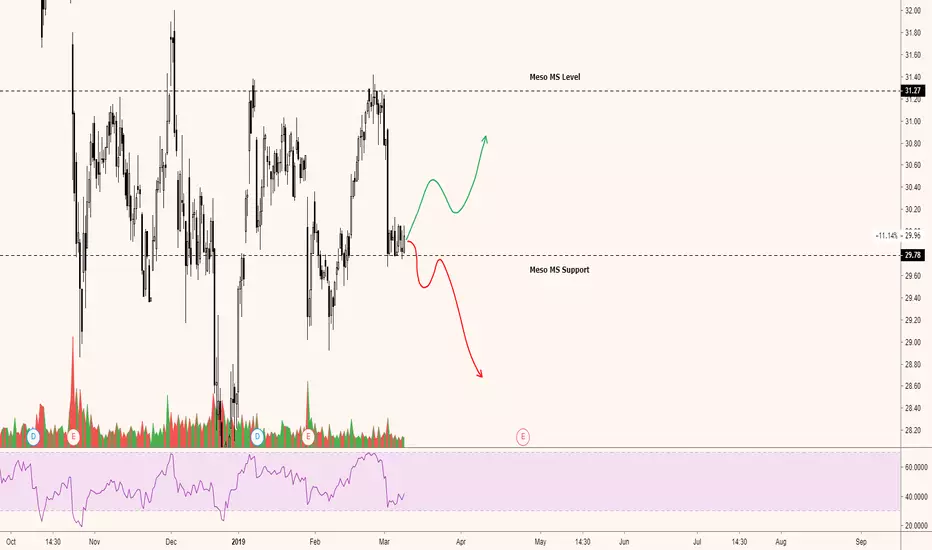
$TConsolidating above Meso support, not many wicks below it, wait for close above 30 ish level before adding longs. wait for break and retest of meso support before shorting.


T longer term playHey guys and gals it's been a long time since I have posted an idea but I have one where the risk to reward is quite appealing, AT&T is in such a nice triangle pattern since its inception and is playing out very nicely and getting quite tight in price. On the monthly chart we see a baby triangle inside a huge triangle, what this means is we are in the loading up stage, at this exact specific time on smaller time frames we are hitting resistances and have some red candles coming in, to me this means perfect opportunity to pick up some shares as it moves downwards in the $26.50-31 range, little by little add shares on dips. This is also a nice 7% paying dividend stock so for each quarter you will be paid to hold this stock. Target for this stock would be at $38 and then $43 if it breaks out, with such a huge pattern, the breakout can be very strong, remember this stock is in a triangle pattern so it can move downwards as well, stops would be under $26 and the move can be epic to the downside as well, so keep an eye on this sucker but I'll be loading up in my dividend portfolio. This $10+ move to the upside can take a year or more to complete so the dividend will be a nice reward for holding that long. Have a great weekend everyone, Cheers!

$T short term upside 10/20 ema cross should send T to the 50 ema on the weekly timeframe at 32. Could be a short term call option swing.


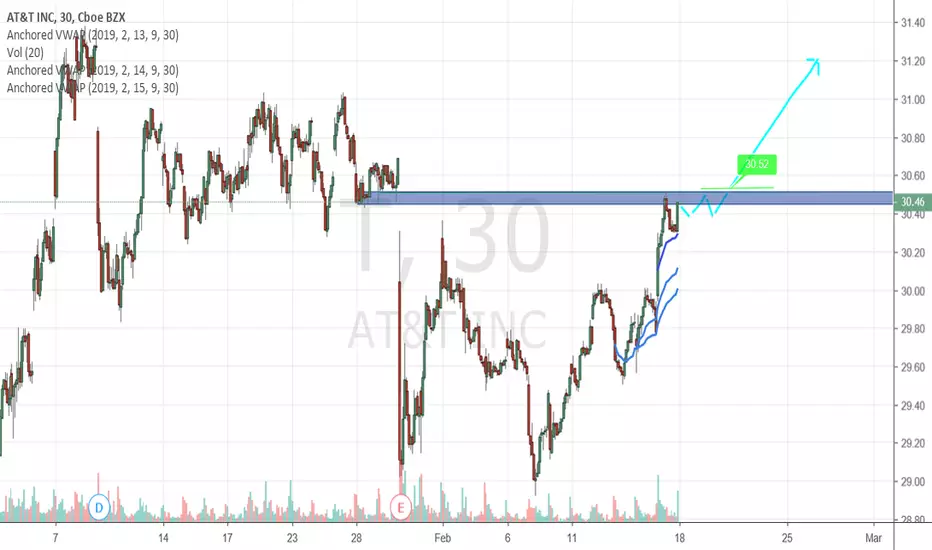
Bullish Setup!!!NYSE:T is ready to get going higher. buy above yesterday's of 30.52 with a stop below 30.30. do not participate if it gaps through the trigger price. let it settle and try to get in at a good price.
AT&T a Good Buy?AT&T's growth has been sluggish. With internet TV becoming more and more popular, the demand for satellite TV is decreasing. As for the cellular aspect, for now their 5g network appears to be limited to some small businesses. The Megalodon is giving us a buy sign on the technical side!
The Megalodon indicator uses an artificial intelligence, combined with data from over 500 buy setups, and over 2000 indicators to produce extremely accurate buy signals on any and all asset classes! Send me a message if you would like to try it for yourself!

IHS reversal in the making?My ideal scenario would be here a breakout from the falling wedge with a possible inverse head-and-shoulders pattern


