T US: Potential 30% upside to low 40'sAT&T is trading on a long-term uptrend yielding > 6% with heavy volume coming in; The set-up looks like an ascending triangle but that is a story for another day. The Time Warner acquisition and repeal of net neutrality is going to a major game changer for AT&T. Forget 5G, it is about content.
T trade ideas


T weekly looks as though if it breaks below 32 its going to 26If it bounces on the 32 it will be heading up


TRADE IDEA: LONG AT&T JUNE 22/29 (Choose your own strikes)Heavily under owned stock great bottoming technicals forming here and especially at $30/$31 so if it drops more keep an eye out.
ENTRY was stock price $32.41


AT&T - short till 27.50 USDAnalyzing the monthly chart, I see we have space to go down till 27.50-28 USd.
Being a monthly chart, it might take time to reach the target, but I see more downside opportunities rather than upside.
Thank you guys,
Simone

| $TWX arb spread < 2%. $T flush pulls deal near $100On alert for TWX call buyers betting on T rebound next week.

AT&T (T)A federal judge gave a ringing endorsement to AT&T Inc's planned acquisition of Time Warner Inc without any conditions.
The company is currently yielding 5.8%, looks to be a solid choice for conservative buy-and-hold investors.


$TThis one has not broke the MACD yet, but this day over day gain is looking really positive. I think we could see it cross by the end of the week and see very good gains. Looks like there is a resistance around $37 and it is gaining volume.

t att&t long Triangle has broken through the resistance line at
. Possible bullish price movement forecast for the next 3 days towards 33.1719.
trade forex here with 500x leverage and crypto and stocks with 100x leverage. usa accounts accepted www.jafx.com

T could see another thrust downI longed T a while ago, but more evidence is now building up that T could see one more thrust downward to the 31.11 level.
1. Bear flag on daily. Not impulsively moving away from the trend line.
2. Failing to break 32.7 resistance area.
3. OBV continuously going downward, showing more selling pressure.


Deal valuing Time Warner at $100 for now.Get cheap $T calls while you can. This pops on deal approval, driving $TWX value higher.

Expected volatility in AT&T The final ruling in the anti-trust case against the proposed AT&T-Time Warner merger is expected on June 12. Either way the decision goes, price movement is likely. Current prices suggest a recovery from the recent decline. Options strategies that hedge against movement in any direction may be profitable.

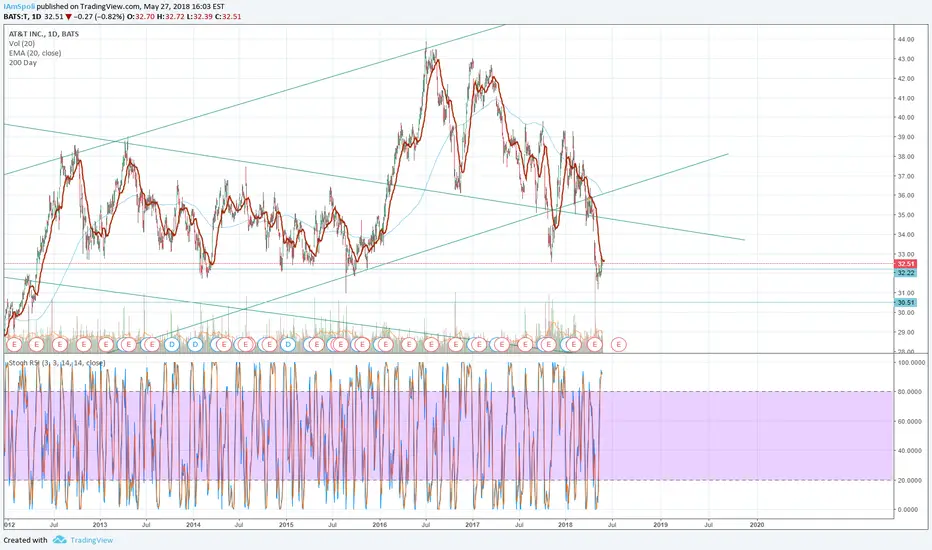
AT&T is in a BUY ZONE - but a drop below $30.50 could mean $26I am long T. I hold a 5% position in my retirement account as a blue chip dividend stock with potential growth (pending merger). I bought in two troughs, at $34 and $32.
I have a mental stop loss at a close under $30.00, because a close under the buy zone likely means a break down to the bottom of my long-term channel.
I don't see that happening and I expect additional consolidation between $30-$34 while the lawsuit with the US Government takes its course to allow the merger to proceed.
I see the merger being allowed, AT&T will benefit substantially long-term, and my investment will continue to pay huge dividends moving into the long-term future.
For the time being, look to see if 30.50 holds and if so, we could get back into the upper trend channel and back to $40. A lot has to happen for this to be so, and the 20-day is acting as HEAVY resistance to breaking out of this bearish downtrend. I see the risk/reward to buying at these levels about 3 to 1, with a higher probability of the upside hitting before my mental stop... and in the meantime, pay me my 5%.
THIS IS NOT A RECOMMENDATION TO BUY OR SELL - THIS IS JUST MY OPINION BASED ON MY REVIEW OF THE CHART. I AM LONG T
AT&T prediction by a rookiePosting this idea here to get input from seasoned chartists and for me to look back to see if my prediction is correct.. This chart is an hourly chart. This move is part of a wave 3 correction. Shortterm LONG, longterm NEUTRAL.

Elliott wave for $T AT& TI'm a rookie, so do not follow my chart. I'm only posting this here to get inputs and comments from seasoned Elliott wave chartists. I am also posting this year so I can check back on it a few months from now to see if my chart/prediction is correct.

