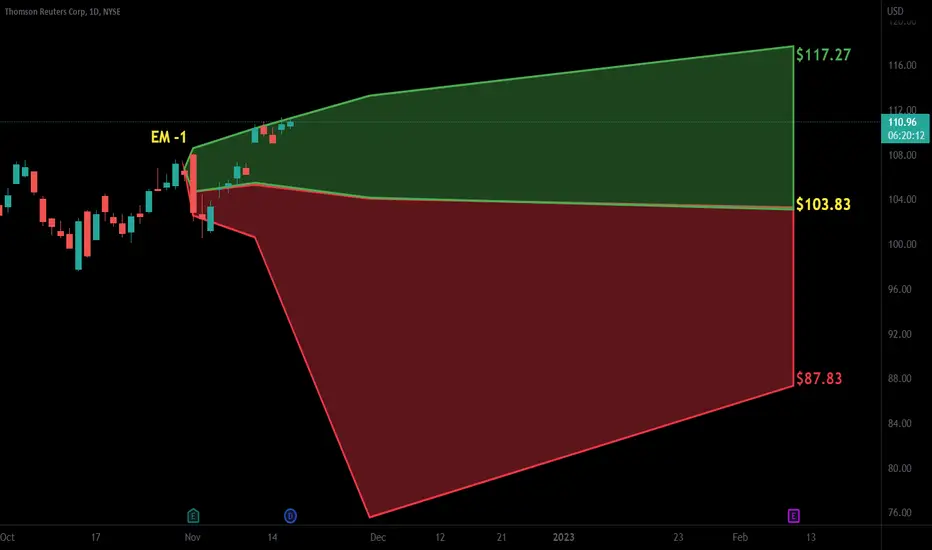
Thomson Reuters | Chart & Forecast SummaryKey Indicators On Trade Set Up In General
1. Push Set Up
2. Range Set up
3. Break & Retest Set Up
Notes On Session
# Thomson Reuters
- Double Formation
* Survey 1 | Ranging Structure At 175.00 USD | Subdivision 1
* Neckline | Support & Resistance Survey 3
- Triple Formation
* Retracement | (0) Resi

$TRI long targetting +20%Stock is hitting new ATHs. The 50-day SMA is above the 200-day SMA which indicates a good uptrend, even though a bit noisy.
Would enter here at 126.1 with a stop at 113.3 and a target of 151.1 .
Please manage your risk when trading.

$TRI with a Bearish outlook following its earnings #Stocks The PEAD projected a Bearish outlook for $TRI after a Positive over reaction following its earnings release placing the stock in drift B with an expected accuracy of 100%.
$TRI with a Neutral outlook following its earnings #Stocks The PEAD projected a Neutral outlook for $TRI after a Negative under reaction following its earnings release placing the stock in drift D with an expected accuracy of 25%.

$TRI with a Bullish outlook following its earnings #Stocks The PEAD projected a Bullish outlook for $TRI after a Negative over reaction following its earnings release placing the stock in drift C with an expected accuracy of 66.67%.

TRI.NYS_Swim Trading VZ Breakout Trade_LongENTRY: 118.27
SL: 112.92
TP1: 124
TP2: 128
- ADX<20. Would like to be higher.
- RSI>50, <70
- Maintaining well at pivot point "P".
- Wash and rinse pattern on 3-4 Nov 2021
- Strength meter shows weakness hence lower position.
- Currently just below HVN.
- Need to watch for reaction after dividend d

TRI positioning itself for a earnings gap up?* Excellent earnings
* Very strong up trend
* High RS in the Industrials sector
* Breaking out of a ~12 week consolidation
Trade Idea:
* Great time to enter as it's extremely close to the broken level with higher than average volume and earnings report is coming out in just a couple of days.

TRIThe technical chart of Thomson Reuters Corp (NYSE:TRI) looks fairly appealing for a possible short term trade. The stock price is forming an ascending triangle pattern on a daily. If price breaks out above 89.69 then we should probably see a significant move to the upside next week.

$TRI with a Bullish outlook following its earnings #Stocks The PEAD projected a Bullish outlook for $TRI after a Positive under reaction following its earnings release placing the stock in drift A
If you would like to see the Drift for another stock please message us. Also click on the Like Button if this was useful and follow us or join us.

THOMSON-REUTERS CORP Course DailyHey people, THOMSON-REUTERS CORP is in a bullish push with a large volume of past purchase and a marubozu accompanied by two legs of which the lower one is the shorter. Zooming in on the TIMEFRAME M1 shows us a marubozu that goes over the top of the bollinger to test it, in order to find the top of

See all ideas
Displays a symbol's price movements over previous years to identify recurring trends.