TSLA SHORT FROM RESISTANCE
TSLA SIGNAL
Trade Direction: short
Entry Level: 286.64
Target Level: 210.88
Stop Loss: 337.30
RISK PROFILE
Risk level: medium
Suggested risk: 1%
Timeframe: 1D
Disclosure: I am part of Trade Nation's Influencer program and receive a monthly fee for using their TradingView charts in my analysis.
✅LIKE AND COMMENT MY IDEAS✅
TSLA trade ideas

Tesla - Don't get confused right here!Tesla - NASDAQ:TSLA - is about to create the bullish reversal:
(click chart above to see the in depth analysis👆🏻)
2025 has been a rough year for Tesla so far. With a drop of about -50%, Tesla is clearly breaking the average retail trader. But the underlying trend is still quite bullish and if position strategy, risk execution and mindset control are all mastered, Tesla is a quite rewarding stock.
Levels to watch: $275, $400
Keep your long term vision!
Philip (BasicTrading)

TSLA HUGE BEAR FLAG! This is such an obvious setup that even a blind person should be able to see it. This is a follow-up to my previous post.
Going all the way back to December 12, 2024, when I first started to warn people to GTFO!

Tesla - The Next 7 Days Decide Everything!Tesla ( NASDAQ:TSLA ) is sitting at a crucial structure:
Click chart above to see the detailed analysis👆🏻
Despite the -60% correction which we have been seeing over the past couple of months, Tesla still continuously validates its overall uptrend. That's exactly the reason for my strong bullish thesis and the assumption, that after we see bullish confirmation, Tesla will reject the current support area.
Levels to watch: $250, $400
Keep your long term vision,
Philip (BasicTrading)

Tesla Grabbing Liquidity Market Context 🚩
1-Month Move: +7.3% (from $261.30)
1-Year Move: +45.6% (from $192.50)
Technicals
RSI: ~68.4 (nearing overbought )
Moving Averages: Above 20-day, 50-day, and 200-day MAs (uptrend, but showing signs of exhaustion )
MACD: Bearish crossover forming (momentum fading, potential pullback )
Trade Setup
Instrument: TSLA ❌
Direction: PUT
Entry Price: $280.21
Take Profit 1 (TP1): $270.00 (~3.6% gain ) 🟢
Take Profit 2 (TP2): $260.00 (~7.2% gain ) 🟢
Expected Move: ~8–10% downward
Best AI Signals on the market.

TeslaFor the first time in Tesla's history, it broke monthly support back in Dec 22. Price came back to mitigate the supply level...and if I am right...just maybe...Tesla is within a distribution range...

Short on Tesla IncTesla has touched the 200 moving average on three separate occasions in conjunction with the nasdaq remaining below the 200 moving average therefore I placed shorts for Tesla and the Nasdaq with stop losses slightly above the 200 day moving average. The risk to reward is potentially significant. Let's see what the outcome is!

TESLA Trading Opportunity! SELL!
My dear followers,
This is my opinion on the TESLA next move:
The asset is approaching an important pivot point 287.25
Bias - Bearish
Technical Indicators: Supper Trend generates a clear short signal while Pivot Point HL is currently determining the overall Bearish trend of the market.
Goal - 262.50
About Used Indicators:
For more efficient signals, super-trend is used in combination with other indicators like Pivot Points.
Disclosure: I am part of Trade Nation's Influencer program and receive a monthly fee for using their TradingView charts in my analysis.
———————————
WISH YOU ALL LUCK

BullflagFrom what I can see, a bull flag is forming. If it breaks out above, I see 340/360 as a possible target, which is also 50% of the decline from the all-time high.

TSLATesla is in a correction phase, the price has a chance to test the support zone 246-218. If the price can stay above 218, it is expected that the price will have a chance to rebound. Consider buying the red zone.
🔥Trading futures, forex, CFDs and stocks carries a risk of loss.
Please consider carefully whether such trading is suitable for you.
>>GooD Luck 😊
❤️ Like and subscribe to never miss a new idea!

Is Tesla Running Out of Road?Tesla has been rangebound for the last two months, and some traders may think it’s running out of road.
The first pattern on today’s chart is the March high of $291.85. The EV maker peaked around the same level in late April and remains stuck there again in early May. That may suggest resistance is in place. Will traders look for a return to the recent lows under $220?
Next, the stochastic oscillator is turning down from overbought territory.
Third, the 50-day simple moving average (SMA) had a “death cross” under the 200-day SMA in mid-April. That may suggest its longer-term trend is getting more bearish.
Finally, TSLA is one of the most active underliers in the options market. (Its 2.7 million average contracts per day ranks No. 2 in the S&P 500, according to TradeStation data.) That may help traders take positions with calls and puts.
TradeStation has, for decades, advanced the trading industry, providing access to stocks, options and futures. If you're born to trade, we could be for you. See our Overview for more.
Past performance, whether actual or indicated by historical tests of strategies, is no guarantee of future performance or success. There is a possibility that you may sustain a loss equal to or greater than your entire investment regardless of which asset class you trade (equities, options or futures); therefore, you should not invest or risk money that you cannot afford to lose. Online trading is not suitable for all investors. View the document titled Characteristics and Risks of Standardized Options at www.TradeStation.com . Before trading any asset class, customers must read the relevant risk disclosure statements on www.TradeStation.com . System access and trade placement and execution may be delayed or fail due to market volatility and volume, quote delays, system and software errors, Internet traffic, outages and other factors.
Securities and futures trading is offered to self-directed customers by TradeStation Securities, Inc., a broker-dealer registered with the Securities and Exchange Commission and a futures commission merchant licensed with the Commodity Futures Trading Commission). TradeStation Securities is a member of the Financial Industry Regulatory Authority, the National Futures Association, and a number of exchanges.
Options trading is not suitable for all investors. Your TradeStation Securities’ account application to trade options will be considered and approved or disapproved based on all relevant factors, including your trading experience. See www.TradeStation.com . Visit www.TradeStation.com for full details on the costs and fees associated with options.
Margin trading involves risks, and it is important that you fully understand those risks before trading on margin. The Margin Disclosure Statement outlines many of those risks, including that you can lose more funds than you deposit in your margin account; your brokerage firm can force the sale of securities in your account; your brokerage firm can sell your securities without contacting you; and you are not entitled to an extension of time on a margin call. Review the Margin Disclosure Statement at www.TradeStation.com .
TradeStation Securities, Inc. and TradeStation Technologies, Inc. are each wholly owned subsidiaries of TradeStation Group, Inc., both operating, and providing products and services, under the TradeStation brand and trademark. When applying for, or purchasing, accounts, subscriptions, products and services, it is important that you know which company you will be dealing with. Visit www.TradeStation.com for further important information explaining what this means.

TSLA: Big Cup & Handle? Over $300 Soon?Big cup and handle? I feel like NASDAQ:TSLA has so much potential here. Ready for a break out of this handle.
I have long calls for 5/16.
Looking for over 295 to possibly 300? Then big move to $324?

"Mastering Trend Confirmation: From Structure to RSI with ALGTP 📌 Custom RSI & Structure Sync with Quantum – How We Analyze with ALGTP
Many traders use different versions of RSI—and that’s totally fine. But with the custom-built RSI in the ALGTP system, we’ve synchronized it with our Quantum Zones and Market Structure, allowing for:
Clear identification of solid Support and Resistance zones—no more second-guessing when price is at a key level.
Accurate detection of reaction zones (R1, R2)—so you won’t jump into trades blindly.
🎯 How It Works in Practice:
✅ 1. RSI Is More Than Just RSI
The ALGTP RSI is integrated with Quantum Cloud and Price Structure.
When RSI hits R1 or R2 without a valid breakout signal → stay out of the trade.
If you're already in → always set a stop loss when you're within R1 or R2 zones.
✅ 2. Watch for "Open" on Quantum Structure
If you see a label called "Open" on Quantum, that means the structure is resetting back to the origin (zero).
At this stage, avoid making early bias calls—wait for AO and RSI to align before reacting.
✅ 3. Use AO & RSI Together to Define Zones
If AO turns flat/sideways (purple bars), and RSI moves into the neutral zone, it signals no momentum—a potential breakout or breakdown zone.
If a breakout happens, RSI will blast through R1, and the system will automatically establish new targets via Quantum.
🔁 4. Final Trend Check: Always Return to the 15-Minute Timeframe
After scanning the higher timeframes (1H, 4H, etc.), come back to the 15-minute chart for confirmation:
If price action is above the 15m Confirmation Trigger → the overall trend remains bullish.
If price closes below Confirmation → the entire multi-timeframe structure flips to bearish.
⚠️ Key Takeaways:
⚡ Seeing R1/R2 without AO + RSI confirmation? → No entry.
⚡ Seeing “Open” on Quantum? → Structure is resetting—be patient.
⚡ Always finish with a 15m check to validate or reject higher timeframe bias.

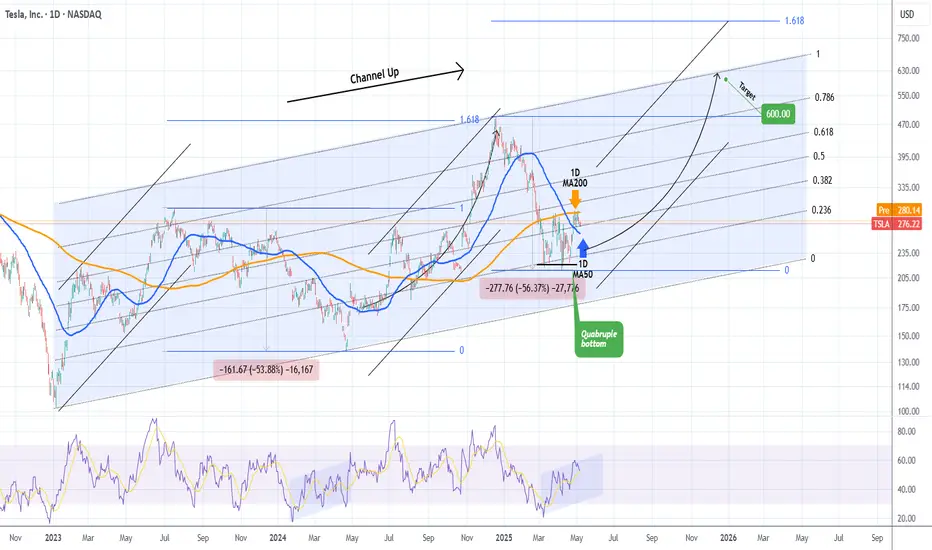
TESLA Is a $600 price tag a pipe dream?Tesla (TSLA) is seeing a steady recovery from the April 21 2025 Low, which has been a Quadruple Bottom, and has found itself consolidating the last 10 days within the 1D MA200 (orange trend-line) and the 1D MA50 (blue trend-line).
The 2.5 year pattern is a Channel Up and this Quadruple Bottom took place exactly on its 0.236 Fibonacci level, with a 1D RSI sequence that resembles the Bullish Divergence of its previous bottom on April 22 2024. The similarities don't stop there as the Bearish Legs that led to those bottoms have almost been identical (-53.88% and -56.37% respectively).
As a result we can technically assume that the current Bullish Leg that will be confirmed with a break above the 1D MA200, will be symmetrical to the previous one, which made a Higher High on the 1.618 Fibonacci extension from the bottom. That is now at $823 but falls outside of the 2.5-year Channel Up, so our long-term Target for the end of the year is $600, which is right at the top of the pattern.
-------------------------------------------------------------------------------
** Please LIKE 👍, FOLLOW ✅, SHARE 🙌 and COMMENT ✍ if you enjoy this idea! Also share your ideas and charts in the comments section below! This is best way to keep it relevant, support us, keep the content here free and allow the idea to reach as many people as possible. **
-------------------------------------------------------------------------------
💸💸💸💸💸💸
👇 👇 👇 👇 👇 👇
Tesla Target: $1500Tesla Mega Setup Alert
NASDAQ:TSLA is forming a rare double cup & handle on monthly chart
Accumulation phase ending
Entry zone: $270–280
Target: $1500–$2000 in 2 years
10x potential if structure plays out!
Don't blink 👀
#Tesla #TSLA #ElonMusk #StockMarket #Investing

TESLA: Bearish Continuation & Short Signal
TESLA
- Classic bearish formation
- Our team expects fall
SUGGESTED TRADE:
Swing Trade
Sell TESLA
Entry Level - 287.25
Sl - 299.67
Tp - 259.90
Our Risk - 1%
Start protection of your profits from lower levels
Disclosure: I am part of Trade Nation's Influencer program and receive a monthly fee for using their TradingView charts in my analysis.
❤️ Please, support our work with like & comment! ❤️

Tsla Look GoodTsla 294 first resist but I can see it pass 300. IMO. clean break and held with volume once rest

TSLA to 370?This is one scenario for the stock, I think this can play. A recovery testing the 0.618 fib level.

TSLA Technical Analysis🚀 TSLA Long-Term Buy Setup (Educational Trade Idea)
I’ve entered a long position on Tesla (TSLA) at $246.57 based on a clear technical breakout from a downtrend and consolidation pattern.
✅ Target: $487.66
❌ Stop Loss: $209.36
📊 Risk-Reward Ratio: 1:6.58 — extremely favorable setup
Price action shows a textbook breakout from accumulation, followed by bullish structure. This move aligns with the Smart Money Concept — entering after accumulation, not during uncertainty.
🕒 This is a long-term swing trade, meaning it could take weeks or months to fully develop.
⚠️ Disclaimer: This is not financial advice, but an educational breakdown for learning purposes. Always manage your own risk and do your own analysis before trading.

TSLA Setting Up for a Big Move?🔎 Big Picture (1D Chart)
TSLA had a solid bounce off that $138–$140 range back in April, and we finally got the trendline break to the upside. But right now… we’re kinda pausing. Price stalled below $280, and the MACD looks like it's rolling over a bit. Also noticed Stoch RSI curling down — not great if you're expecting momentum continuation.
We’re sitting in this tight range just above prior structure — it feels like the market is waiting for something.
🕒 Zooming In (1H Chart)
1H shows a bit more chop than I’d like. There’s clearly some pressure under $278 and buyers haven’t stepped in aggressively. That trendline break we had from April is still valid, but price is walking sideways. Kinda reminds me of distribution vibes unless we reclaim that $284–$286 area quick.
MACD is flat, and Stoch RSI bounced from oversold but isn’t convincing just yet.
🧠 Options Flow + GEX Insight
This is where it gets really interesting…
* Gamma Wall / Call Resistance: $297.50–$300 is the GEX lid. Tons of calls stacked there — if TSLA starts squeezing, that’s the magnet.
* PUT walls: Strongest net negative GEX is at $270, followed by $260. That makes $270 my short-term line in the sand — if we lose it, volatility probably spikes fast.
* HVL (High Volume Level): Lined up with $275–$278 zone. That’s right where price is dancing now.
💡 So the GEX map shows we’re trapped between a wall and a floor. Could be a coil before a breakout — or a fakeout flush before a rip.
💬 My Game Plan
Honestly, I'm playing this one day by day. Here’s how I’m thinking about it:
Scenario A – Breakout
* Entry: $285+ reclaim with volume
* Target: $297.50, then $300
* Options idea: Weekly 290C or 295C lotto if IV stays tame
Scenario B – Breakdown
* Entry: Below $270 with momentum
* Target: $260 zone
* Options idea: 265P or a debit put spread targeting $260 if VIX is friendly
Neutral Trade
* I might scalp inside this range ($270–$280), but it’s tricky. If I see chop, I sit. No reason to force it.
📌 Final Thought
TSLA looks like it’s prepping for something — we’re at a balance point between option pressure and fading momentum. If you’re a scalper, be nimble. If you’re swinging, this might not be the cleanest entry just yet. But when it moves, it’ll move fast.
Trade smart. Protect your capital.
This post is just my view — not financial advice. Do your own research and stay sharp out there!

TSLA Drill Team is Back
Against the background of everything that is happening, from a fundamental point of view, Tesla is facing significant headwinds as we approach its Q1 2025 earnings.
A 13% year-over-year decline in deliveries, ongoing margin pressures from price cuts, and negative consumer sentiment tied to Elon Musk’s political involvement are weighing on the company.
While the energy segment and potential updates on the affordable vehicle could provide some upside, the risk of a disappointing earnings report looms large, potentially exacerbating Tesla’s challenges in a competitive EV market.
Technically
We see that the price is consolidating near the lower boundary of the golden pocket on the FIBO channel on the 1-hour chart. For a few days now, the price has been holding just above the 240.00 support level, but the bearish trend remains dominant with 23 out of 26 technical indicators signaling bearish sentiment as of April 20, 2025.
Entry SHORT around 240$ targeting 220$
Post-earnings, we could see a breakdown below 220.00, targeting the next support at 216.00, from which the future prospects will depend.
Resistance levels: 270, 250, 240
Support levels: 220, 216, 210
The price is struggling to break above the resistance, consolidating over days. With earnings on Tuesday, there’s a high probability of a breakdown if the report misses expectations or lacks clear guidance on growth initiatives.
A break and consolidation below 230.00 could lead to a decline toward 220.00 or even 210.00 in the coming week.
However, if Tesla surprises positively—particularly with strong energy segment growth or clarity on the affordable vehicle—we might see a reversal. Still, the current setup suggests caution, and we’ll need to monitor the price reaction closely post-earnings.
Keep your long term vision NASDAQ:TSLA

$TSLA – Base Breakout Setup with Dual Entry StrategyTesla ( NASDAQ:TSLA ) is coiling up, forming a classic base breakout setup with a dual approach for traders who want precision:
🔹 Support Zone Entry (280-285)
Shaded area = the zone between the 9 EMA (blue) and 20 EMA (yellow) — a key dynamic support area.
I'm taking a starter position here with a stop just below yesterday's low for tight risk control.
🔹 Breakout Confirmation (Above 295)
Full size only if we see a clean breakout above $295, confirming momentum.
This is where I’ll add size, looking for a strong continuation.
🔹 Execution Plan
Starter position: Shares and options at support zone ($280-$285).
Full position: Add at breakout ($295) with a mix of shares and options.
Risk: Tight stop below yesterday's low for the starter position.
⚠️ Risk Management: Always respect your stops — discipline over hope.

TSLA technically turntUP... so the stock pops on a sob story. there will be action. pullback possible, but doesn't have to. 2-3 week rallies expected while the getting is good.
*weekly bullish close (engulfing)
*pullbacks should not be lower than prev week high (270 good)
*it's big tech earnings, so running during other strong tech success while down is a TSLA thing
tootles
