Tesla is About to Collapse… or Skyrocket—Are You In?Tesla is all over the news with boycotts, drama, and market chaos, but the real action is on the charts. If we break below 222, things could get ugly fast with a drop toward 197, 186, and even 176. But if we hold above 223, momentum could send us flying past 232, 237, and potentially 256 or even 264.
Big money is watching, and the next move could be massive. The question is—are you trading this or just watching from the sidelines?
Kris/ Mindbloome Exchange
Trade Smarter Live Better
TSLA trade ideas
I don't think US markets have bottomed outThe US stock markets are down.
I don't think they've bottomed out - there could be further downside to come - but this could be a fantastic opportunity for longer-term traders and investors. Buying the dip is often profitable for buy-and-hold investors.
As a trader, I'm still actively looking for index shorting opportunities.

TSLA (Tesla) long set up Entry 1 $220.00
Entry 2 $200.00
Stop loss $180.00
Take profit 1- $250.00
(Close 33%)
Take profit 2- $290.00
(Close 66%)
Take profit 3-$330
(Close 100%)


Tesla (TSLA) Shares Drop Over 15%Tesla (TSLA) Shares Drop Over 15%
Among the biggest decliners in the technology stock index (we covered the reasons behind the Nasdaq 100’s drop earlier this morning) are Tesla (TSLA) shares, which have plummeted by more than 15% in a single day—their worst performance in five years.
Why Tesla (TSLA) Shares Fell
One of the key bearish drivers behind Tesla’s stock decline appears to be Elon Musk’s political involvement in the Trump administration. For investors, this could signal concerns that:
→ The CEO is not devoting enough attention to the automaker’s operations.
→ Discontent among those who oppose Musk’s political stance could slow Tesla’s sales.
And what about Musk himself? He has:
→ Acknowledged that business is “tough,” particularly following a cyberattack on his social media platform, X, but stated he intends to focus on politics for at least another year.
→ Reassured investors that, in the long run, “everything will be fine.”
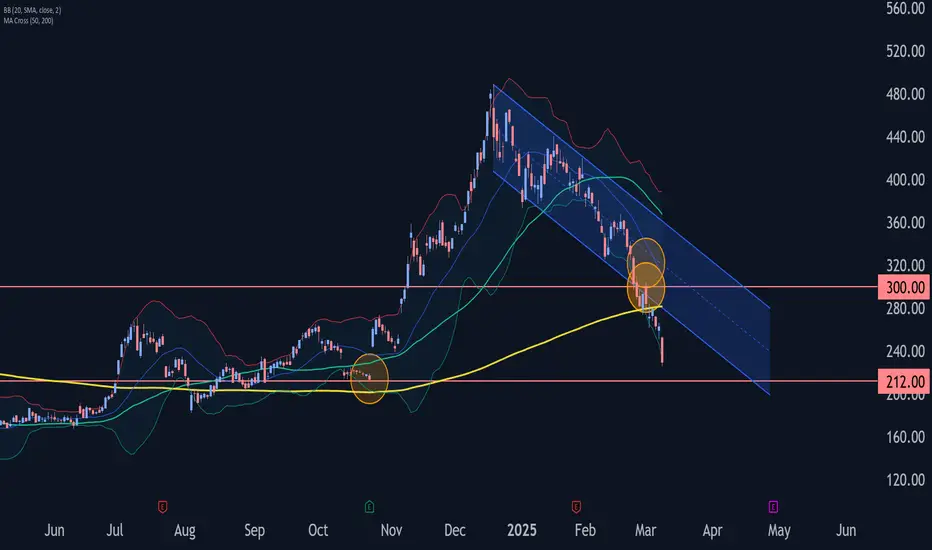
Technical Analysis of Tesla (TSLA) Stock Chart
In our previous analysis, we identified a descending channel (marked in red) and suggested that if the psychological support level of $300 per share failed to hold, further declines could follow.
With updated chart data, we can see that:
→ The downward channel remains valid, reinforced by a test of its median line (marked by an arrow).
→ The $260 level (previous support) and $300 may act as resistance going forward, with the orange descending trendline also potentially serving as resistance.
Since the price has now fallen below the lower boundary of the red channel, there is a possibility that bulls may attempt to recover some losses, banking on a long-term rebound.
Tesla (TSLA) Stock Price Forecast
Analysts remain cautiously optimistic, possibly hoping that Musk’s close ties with Trump will accelerate Tesla’s rollout of its robotaxi service. Another potential positive catalyst is Tesla’s market entry into India.
According to TipRanks:
→ 13 out of 36 analysts recommend buying TSLA shares.
→ The average 12-month price target for TSLA is $340.
This article represents the opinion of the Companies operating under the FXOpen brand only. It is not to be construed as an offer, solicitation, or recommendation with respect to products and services provided by the Companies operating under the FXOpen brand, nor is it to be considered financial advice.

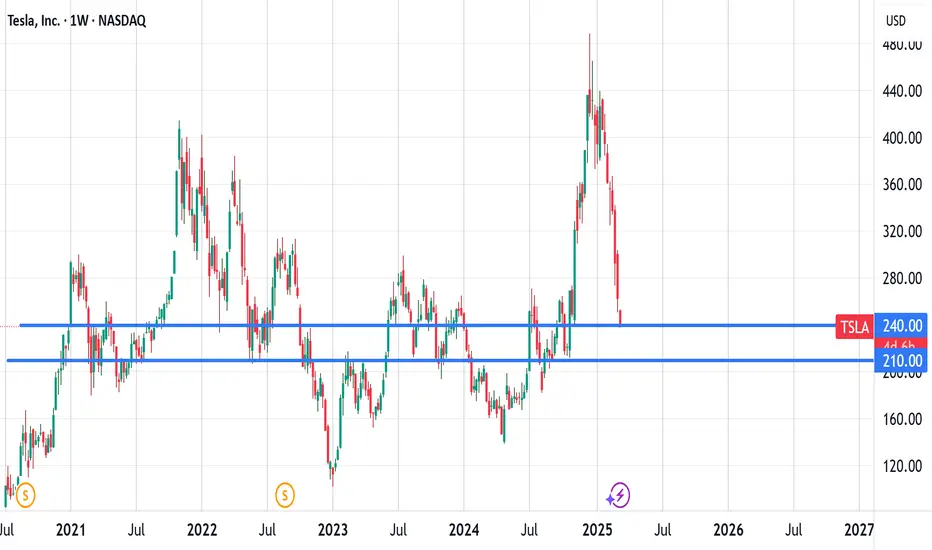
Tesla (TSLA) Weekly Chart Analysis – Key Levels & Market OutlookTesla (TSLA) Weekly Chart Analysis – Key Levels & Market Outlook 🚀
1️⃣ Overall Trend:
✅ Long-Term Uptrend (2019-2021): Tesla experienced a massive rally, reaching all-time highs.
🔻 Correction Phase (2022): A significant pullback led to a strong downtrend.
📈 Recovery Mode (2023-Present): The stock started forming higher highs and higher lows, indicating a bullish structure.
📉 Recent Pullback: The price is now retracing from recent highs, showing potential short-term downside momentum.
2️⃣ Key Support & Resistance Levels:
📌 Support Zones:
$300: A critical level—if it breaks, Tesla could drop further.
$260 - $280: The next demand zone if selling pressure continues.
$240 - $250: Strong historical support, previous swing low.
$180 - $200: A major long-term base where Tesla found strong demand before a rally.
📌 Resistance Zones:
$380 - $400: A strong rejection zone—Tesla recently pulled back from here.
Above $400: A breakout could send TSLA toward $500+ (previous cycle highs).
3️⃣ Candlestick & Price Action Observations:
📉 Bearish Momentum:
The latest weekly candle is red, indicating strong selling pressure.
If Tesla fails to hold $300, expect a move toward $260-$280.
📊 Potential Bounce Area:
If buyers step in, Tesla might consolidate before another leg higher.
4️⃣ Market Context & Indicators:
🚗 EV Sector & Nasdaq Trends: Tesla follows macroeconomic conditions and overall tech sector movements.
📆 Earnings & News Catalysts: Watch for updates on deliveries, margins, and macro sentiment.
📊 Technical Indicators:
✅ Moving Averages:
50-Week MA: A close below this could signal weakening momentum.
200-Week MA: A crucial long-term dynamic support.
✅ RSI (Relative Strength Index):
Not oversold yet—watch for levels near 30 for potential reversals.
✅ MACD (Moving Average Convergence Divergence):
Bearish crossover forming? A confirmation could indicate further downside momentum.
✅ Fibonacci Retracement:
Retracement levels align with $260 - $280 as a possible bounce zone.
5️⃣ What’s Next?
📌 Bullish Scenario: If Tesla holds $300, expect a potential rebound toward $350-$380.
📌 Bearish Scenario: A break below $300 could lead to a test of $260-$280, with downside risk toward $240 - $250 in extreme cases.
🚀 Key Question: Will Tesla hold support and bounce back, or will sellers push it lower?
💬 Drop your thoughts below! 🔥📉📈

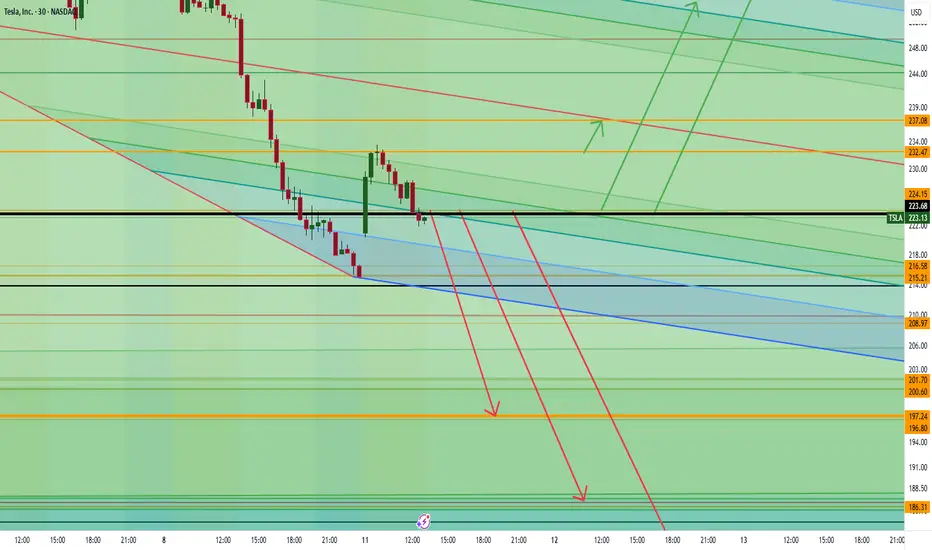
TSLA: What is going to happen on Tuesday, March 11 Analysis:
Looking at today, Tesla dropped another 15.43% ($40.52) and 3.22% ($7.14) in aftermarket. It broke through the supporting line of $250, passed through the middle linear regression line (look back period of 160) and ended up below the bottom deviation of 2.
At this point, it’s sitting around $215, barely holding at this level. The next key support is around $210, lining up with the lower bound of the channel. If it doesn’t hold, we could see further downside movement within the trend and even a crash down to below $200.
Although RSI does point to oversold, TRAMA still indicates that it is on a strong downward trend. Any bounce might be short-lived. The only key resistance level above this current price is at $232, but with the current trend, it is super unlikely it would test this upper extreme for the following days.
Personal Opinion:
With the current situation regarding politics and tariff wars, we’re likely to see more volatility in Tesla’s price action. For instance, Reuters noted that Tesla’s shares dropped 15.4% in aftermarket trading after breaking through key support levels, signaling investor anxiety over heightened macro risks . If tensions escalate and stricter tariffs are imposed, the stock could be pressured down even further. As tariff-related uncertainties continue, the chance of Tesla dropping below $200 are more and more likely .
That said, Tesla has historically rebounded faster than any other stock. Data from Nasdaq and related market analyses have shown that after steep declines, Tesla’s often comes back with a fast recovery. If any consolidation happens, a reversal might happen.
Personal Strategy:
My new long-term entry price would be at $232 with a strong break out and closes above the upper 2nd deviation line.
My new short-term long would be a retest at $210 and a take profit at $220
Disclaimer: This is my personal trading perspective and not formal investment advice. Always do your own research, double check my findings, and manage your risk accordingly.
Links to Quotations:
AP News
Investopedia

Tesla 2025 bottom predictionIm planning to buy on Tesla once we hit the bottom and once we are in monthly weekly demand on the nasdaq :)

The Tesla free fall continues!boost and follow for more! ❤️🔥
TSLA bulls lost major support after failing to hold 200 SMA and major trend support zone,which is why the selling pressure has been so bad the last week or so 🩸 there is a last line of support here around 200-210 area..
if it can hold support here then we likely rally higher back to 300-400🚀, if not the another 25% pullback is possible, there is not much support left under 200!
all eyes on tesla, this week. good luck to all. see you soon with more ⚡

TESLATESLA would enter a consolidation phase around 200- 180. When Everyone is Panicking it would be a great opportunity to enter long either to hold or swing with small SL as described.
sharing your Idea down below would beneficial to overview the markets well...


TESLA: Ready For TakeoffAfter a massive move to the downside, in-line with general seasonality, and aided by the recent stock market drop we are now at major support zones, mainly a fill of the CME gap between $250-$275. Should we see further downside, it may be a generational buying opportunity here as we are trading just slightly above the bear market value area high.
Losing $250 however would be quite bearish and force a rotation potentially back to the previous range POC and even VAL of the range at the $200 zone.
Not to mention, we are slightly dipping below the 200MA, which is historically an amazing buying opportunity!
Only time will tell.
Good luck!

Tesla on the Edge – Key Support or Deeper Drop?📉 Tesla on the Edge – Key Support or Deeper Drop? 🔥🔍
Tesla is in freefall, dropping nearly 9% today. The stock has plummeted from its highs near $500, now testing the critical $220-$200 support zone.
📊 Key Levels to Watch:
📌 Holding $220 could trigger a relief bounce towards $275+.
📌 A breakdown below $200 could open doors to $160-$180, or worse.
🔎 What’s Happening?
Tesla, along with X and SpaceX, is under intense scrutiny amid political pressure, regulatory battles, and even cyberattacks. This aligns with the broader market uncertainty, as Bitcoin struggles to reclaim $79,478.
👀 Elon Musk is in the spotlight, facing global resistance, from social media wars to business challenges. Could this spell opportunity or more downside for Tesla?
⚡️ Will TSLA rebound, or is it heading even lower? Let me know your thoughts below!
One Love,
The FXPROFESSOR 💙
#Tesla #TSLA #ElonMusk #StockMarket #Trading #TechStocks

TESLA important support. Are positive days coming?TSLA coming to an important support level. It can bounce back for a while, It dropped %55 from top.
Positive days coming?
Many cryptocurrency dominance charts, as well as Nasdaq and stock charts too, showing the same pattern. Is the reversal starting?
Check my other analysis too.
We’ll see.
This is not investment advice. Please do your own research.
Wishing you best.
-YusufDeli

Tasla AnalysisI have analyzed the Tesla stock using the trend, candle pattern & Gann system. Reach the conclusion and target. I have taken time-cycle and price cycle in my analysis.
I am available in X as "skumarinsweden"

Tesla Wave Analysis – 10 March 2025
- Tesla falling inside sharp impulse waves 5 and (C)
- Likely to fall to support level 212.00
Tesla falling inside the sharp downward impulse wave iii, which started earlier from the round resistance level 300.00 (former support broken in February).
The price earlier broke the support trendline of the daily down channel from December – which signalled the acceleration of the active impulse waves 5 and (C).
Tesla can be expected to fall to the next support level 212.00 (former monthly low from October) and the target for the completion of the active impulse wave 5.
Long at gap fill between $213 - 217TSLA Daily Chart
90-Day Cycle (March 15, 2025) – Gann called this the most important cycle of the inner year. Swing highs/lows tend to develop here, with potential culminations at the 90- to 98-day mark.
Kumo Twist (March 13, 2025) – High probability of a swing high/low forming around this date.
Indicators & Signals:
Large gaps between the Tenkan-Sen and candlestick bodies.
Composite Index is rebounding off historical support and could cross above both its fast and slow moving averages.
Trigger to Watch: Detrended Price Oscillator needs to cross above the zero line—still a long way from that happening.
TSLA Weekly Chart
90-Day Cycle Window: 13 bars from the December 16, 2024, high puts the 90-day cycle between March 10 and March 17, 2025.
Composite Index is at its lowest since November 18, 2013.
Detrended Price Oscillator just hit its third consecutive weekly all-time low.
Large gaps between candlestick bodies and the Tenkan-Sen.
Potential Reversal Timing: If Tesla reverses, it may not see meaningful upside until Span A and Span B start pointing higher—April 21, 2025, to May 5, 2025.
Conservative Entry: Watching for a gap fill from the October 23, 2024, daily candle at $213 – $217.

TESLA, DAILY CHART FOLLLOW THE CHART ACTIONLooks like this year we can see 172-175 price range for Tesla for Investment opportunities.

Let's buy some tslaSentiment is beyond terrible. TSLAQ is pounding their chests calling for prices below $200. Scott Galloway is taking victory laps as i write this. But, this looks like a pretty logical place to put in that higher low. I love buying big monthly levels like this, at the 200 week moving average, outside of the weekly bollinger bands, but you do you boo boo.

@TSLA LONG TERMto buy tsla long term at $180s
oiuiuiyuryrwfafdjkllkm.n,m,nbmcbxzvczvxn,lhkgdhfsfgsgd

Tesla I Tipping Point: Short Opportunity with Head & Shoulders Short opportunity on Tesla
Based on Technical + Fundamental View
-market structure
-Head and shoulder pattern
-Double top
-Currently trading at supply zone which was a recent support and now an ideal place for a reversal to create the right shoulder of the bigger head and shoulder pattern - Daily time frame
-Product Development Delays
-Margin Pressure
-Decreased average selling price
- Increased Competition
- Flat /Declining Sales
- Leadership Concerns: Elon Musk's polarizing political activities and his divided attention between Tesla and other ventures (such as his involvement with OpenAI) have raised concerns among investors. Some analysts suggest that Musk's public perception may negatively impact consumer sentiment towards Tesla, leading to decreased sales and loyalty among customers.
Technical view
Double top
Unlike the classic double top, where the second peak reaches or exceeds the height of the first peak, the Type III double top fails to reach the previous high. This failure signifies a significant shift in market sentiment and an increase in selling pressure than usal.
Head and shoulder pattern - Pretty visible. Right shoulder is yet to be formed, Which makes an ideal place to SELL with a Risk Reward ratio. (Approx 1:6.4)
Pro Tip
Wait for a bearish candle stick pattern to execute trades on end of the day keeping stop loss somewhere above the supply zone.
Target 1 - 307$
Target 2 - 271$
Target 3 - 237$
Stop Loss - 380.21$
Fundamental View
Valuation Concerns: Tesla's stock is currently viewed as significantly overvalued, with a fair value estimate of $210 per share according to multiple analysts, including Morningstar and Firstrade. This valuation reflects a substantial premium over its current trading price, indicating potential downside risk for investors.
Earnings Performance: Tesla's Q4 2024 earnings are anticipated to show continued improvement, with expectations of gross profit margins exceeding 20%. Analysts believe that the automotive segment's performance has stabilized after a challenging first half of the year, driven by increased deliveries and lower production costs.
Market Dynamics: Despite strong demand for Tesla's vehicles, the company faces pressures from declining average selling prices due to price cuts implemented in 2023. This trend is expected to continue as competition intensifies in the electric vehicle (EV) market.
Product Development: Tesla is set to launch new models, including an affordable SUV (Model Q) aimed at increasing market share in the lower-priced vehicle segment. Additionally, advancements in autonomous driving technology are critical for future growth, with plans to roll out Level 3 Full Self-Driving software in select states and regions.
Analyst Ratings: The consensus among analysts remains mixed, with a combination of "buy," "hold," and "sell" ratings. The average price target reflects a cautious outlook, suggesting that while there is potential for upside, significant risks remain due to valuation concerns and competitive pressures.
Not an investment Advise

Gaps and trendlinesAs you can see the previous gaps were closed but there are still many open to the downside
and the uptrend is over at least for now.
I'am just highlighting something to aware of.
Also the gap between 218 and 242 is partially closed meaning it has a higher probability of closing all the way.

#TSLA - #TESLA is under pressure!if the $240 support can't hold, the next support would be around $210.
TSLA is already declined about 50% from the top on Dec 2024!