TSLA BUYTesla isn't just a car company anymore — it's becoming an AI and robotics powerhouse. With the launch of the Tesla Bots “Optimus" and the upcoming RoboTaxi network, they're tapping into two trillion-dollar industries: robotics and autonomous transportation. All upside from here.
TSLA trade ideas
Short term TSLA Price best guess road mapattached a TSLA trading road map; It will be fun to see if this is how things play out.short term: 1st try arrow now starting Mon small pullback, start up Tuesday peak by May 2?
Then pullback Starting May 2-3 Mid Mayto 288 chop for a week then back up ( if the market tanks to new lows then the red alternate arrow is more likely as all stocks strong and weak are sold.)
If TSLA holds 288 area then back up By July1 into about to early July (2nd try arrow)If iTSLA can do this and broad market isn't a mess then 400 will be reached in months ahead

$TSLA : The road to 400 $In this space we have discussed about NASDAQ:TSLA multiple times. In one of our very recent blogs on 21 April 2025, we flipped bullish for the first time and presented a case to accumulate NASDAQ:TSLA between 214 $ – 250 $. Congrats to everyone who did it. On Friday’s close the stock is above 250 $ and its currently sitting above its 20-Day and 50-Day SMA. This can be taken as a first bullish sign and maybe the start of a primary reversal trend towards up. After some turbulent time and more than a 50% dip the stock is holding up very well.
As Elon will be back on the helm of the NASDAQ:TSLA we can expect some more macro tailwind for the stock itself. In the daily chart below, we see that the RSI chart has flipped bullish and on the Fib retracement levels we are well above the 0.382 Fib retracement levels which is at 272 $. The next stop as per the chart is 310 $ @ 0.5 Fib level. My assessment is that once the momentum is flipped bullish the stock can end above 400 $ once this is all said and done.
Verdict: Go Long $TSLA. 400 $ see you there $TSLA.

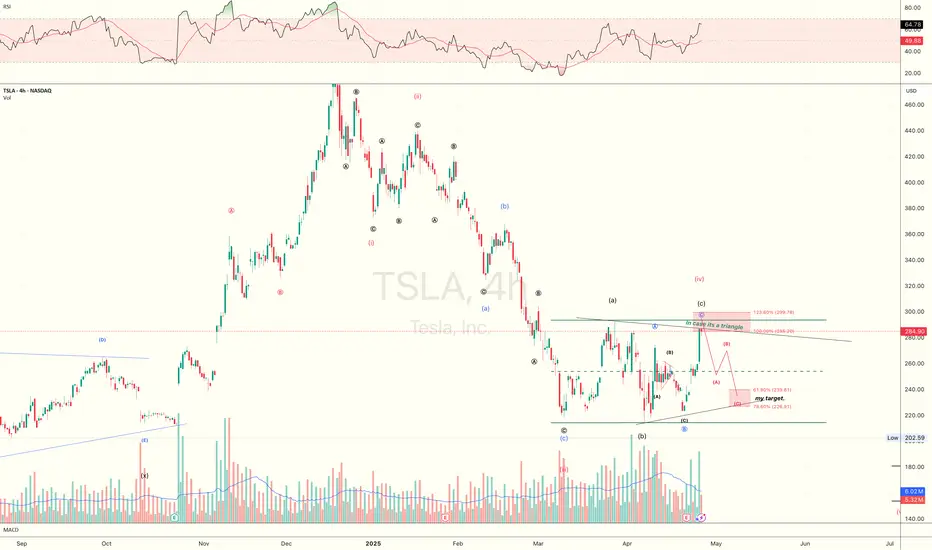
Either a triangle start forming or a flat just completed. $TSLAThe Friday bounce was huge and expected, but be really cautious as its very a typical Tesla move.
At this point, i believe the triangle to be complete in next 2-3weeks(likely), or a flat just complete(also acceptable though i'm leaning less toward this scenario).
And, I bought puts yesterday, let's see what this plays out.
Just sharing my honest thought here, feel free to challenge my view and post opposing counts, always willing to learn new knowledge.
Trade Review (TSLA)Trade Review (TSLA)
key notes
- displacement -> consolidation. no bearish CISD or MSS on higher time frames
- pullback into OTE of original displacement
- unswept liquidity targets
- 4hour bullish market structure shift
- displacment, creation of a HTF fair value gap and retracement into fair value gap (Entry)
- exit at internal buyside liqudity

TSLA at the Crossroads: Multi-Pattern Breakout Brewing at 288
📈 TSLA 4H Chart Analysis – A Confluence of Multiple Technical Patterns
TSLA is currently forming a highly significant confluence zone around the 288 level, acting as a key neckline that's been tested and established over multiple sessions. This isn't just a single pattern at play — it's a combination of several overlapping structures across different perspectives.
🔍 Pattern perspectives observed:
Cup & Base
Cup & Handle
Inverse Head and Shoulders
Multi-VWAP Support Zones
Each pattern aligns differently, but all converge around the 288 price level, making it a critical zone of structural importance.
📊 Supporting momentum and confirmation signals:
RSI has broken above the zero line, showing clear buyer strength
Awesome Oscillator (AO) signals a strong reaccumulation phase
Price has successfully broken out above the 294.86 resistance zone, indicating a shift in trend
Multiple timeframes (2m to 4H) are in full alignment with Buy signals
💬 Conclusion:
TSLA is entering a potential breakout phase, driven by a powerful confluence of technical patterns all meeting at the 288 neckline. With momentum confirmed and buying pressure in control, the probability of TSLA rallying from 288 toward the 360 zone is notably high.
Disclaimer:
This analysis is for informational and educational purposes only and does not constitute financial advice. Trading stocks involves significant risk, and you should only trade with funds you can afford to lose. Always do your own research or consult with a licensed financial advisor before making trading decisions.

Why I'm not holding Tesla Tesla was dropping! I got in at around 220. However, within three weeks, I sold for a small profit.
BUT, why did I sell? This is why I'm not holding NASDAQ:TSLA
It's time to buy!
From a technical and historical point of view, buying Tesla right now makes perfect sense. The stock has a history of making significant price gains, is currently oversold, and is testing key support areas, such as the monthly 50 SMA.
A trader or investor who is 100% technical-based, this stock looks like a dream.
However, all the hype hits the floor when the fundamentals are considered...
Meh...
✔ The company has been increasing sales and cash year-on-year until recently
✔ Tesla has plenty of cash and assets. A simple acid test ratio shows liabilities vs. assets around 1:2.
❌ The issue is profit. Both gross and net profit margins have been falling year-on-year. The net profit margin is down from 15% two years ago to 7% last year.
❌ Worse, the current forecasts predict decreased sales and other key financials.
Poor and worsening financials are a clear red flag when buying stocks. Stay away. No matter how appealing the price looks.
Don't get me wrong, I don't think Tesla is doomed, and it may still yield returns. However, I would not be surprised if the stock consolidates or moves lower from here. For me, Tesla is not the significant buy it once was.

$TSLA trading opportunitiesObjectives:
- Trade objective is to build a full position into TSLA before market recognises FSD revenue
- Happy to accumulate more, to lower average cost
What happened:
- Market structure for TSLA remains bullish in the mid to long term with Market Bias indicator maintaining green
- Observed weaker BX-trender indicator on daily basis, suggesting weaker purchases from market movers
- short term topped at $290s
- expecting some pull back to smart money buy zone at $260s - $270s
Next steps:
- i will take long position into TSLA at smart money buy zone

Mid Week Market Update (April 30, 2025)Just a little quick mid week update on the markets so far looking at AMEX:SPY NASDAQ:QQQ NASDAQ:TSLA TVC:USOIL NASDAQ:META NASDAQ:MSFT

Long TSLA if it opens up tomorrow. Could get bad if it drops.
TSLA Buy/Hold/Sell zones. Huge green area if it opens higher tomorrow.

Daily Price Action: TSLA Tuesday 4/29/2025In this video, we will be looking into the potential price action TSLA.

TSLA 4H chart analysisPrice: 275.59, down 3.28%.
Trend: Bearish (red TrendShift), confirmed by MACD (bullish momentum fading).
Support: 222.79 (strong, multiple tests).
Resistance: 274.68 (recent high, failed breakout).
Volume: 11.2M, declining on upticks, suggesting weak buying pressure.
Indicators: MACD bearish crossover, TrendConfirm bearish.
Outlook: Likely to test support at 222.79; break below could target 200.00. Resistance at 274.68 caps upside.
Price Action with S/R and MACD

TSLA Bull or bearish NASDAQ:TSLA 28-04.2025
TSLA is looking suspicious, but the market is still bearish until proven otherwise other words until price moves back and above the fair value gap in the S&P 500 and re establishes up trend. Price can add on to the confirmation of the newly broken resistance and then rebound for further confirmation and then add on upward. Or this will turn out to be a more likely false break out and then bounce back into then consolidation chamber.

Tesla trading planTesla is also in my list and is the most hit during trading War n most heated were by even cars n stations were burning down by that it lead musk to lost more than 130 billion dollars in his networthy but it looks promising for further growth as you can see I trust my work and is always put smile in my face n growth,try by all means to position yourselfs in one of the stocks I've sent and note that we don't control the market,no matter clear structure can be we trade responsibly n risk very smart all the best

Al' set Tesla?Tesla. Take me to "Higher Highs Lane". I believe support is dominate in this case and will most likely send Tesla to new highs. Who knows, Elon may be the first trillionaire.

tesla inc what a beauty in the chart tesla inc can do well a very promising chart, a good upmove can lead to 360+ levels

TSLA bottom on Weekly chartI am calling a temporary bottom on TSLA stock due to Ichimoku cloud support on the Weekly chart. Ignore the bad news and all the other things going on. Price is everything. Stop losses should be placed below the cloud support. If It keeps going down and I end up being wrong SO BE IT. If it goes up from here then you can thank me later by buying me a coffee with your profits. But no Starbucks coffee please. I don't consider that coffee, more like road tar. Carry on recruits.

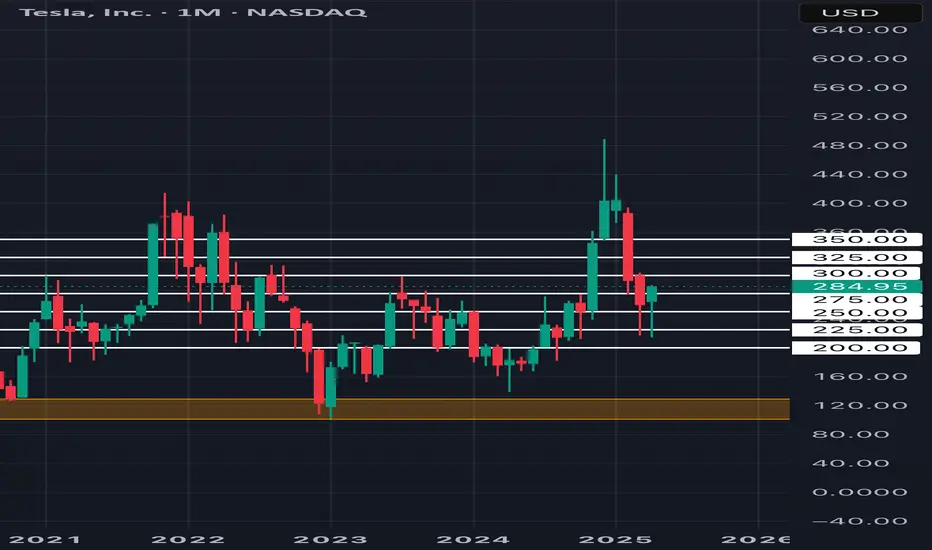
TSLAThe Future of Tesla Stocks: 2025 Outlook
Current Situation
As of late April 2025, Tesla (TSLA) is trading at approximately $284.95, with notable volatility
Bullish scenarios: Some forecasts see TSLA reaching $360 or even as high as $800.70 by year-end, especially if Tesla executes well on new products and technology.
Bearish scenarios: More cautious analysts, such as those at Wells Fargo, warn of a possible drop toward $130 if deliveries and margins disappoint, citing intense competition and slowing demand.
Most forecasts for 2025 fall between $284 and $800, highlighting high uncertainty and volatility in the stock’s outlook.
Key Drivers for Tesla’s Stock Performance
1. Vehicle Deliveries and Production
Tesla is expected to deliver between 1.95 million and 2.5 million vehicles in 2025, with growth driven by new models like the Cybertruck and more affordable vehicles.
Any production setbacks or failure to meet targets could pressure the stock.
2. Technological Innovation
Success in rolling out Full Self-Driving (FSD) features and the anticipated Robotaxi service could be transformative, potentially boosting profit margins and investor sentiment.
However, delays or regulatory hurdles could dampen optimism.
3. Competition and Market Share
Tesla faces growing competition from legacy automakers and new EV entrants, especially in China and Europe.
Its EV market share has slipped below 50% in key regions, raising concerns about sustaining growth.
4. Financial Performance
Revenue is projected to grow by 17.5% to $117.2 billion in 2025, with EPS also expected to rise.
Margins are under pressure due to price cuts and rising costs, a key risk factor.
5. External and Market Risks
Macroeconomic conditions, such as interest rates and consumer demand, will influence stock performance.
CEO Elon Musk’s leadership and public perception remain influential but can also be a source of volatility.
Long-Term Potential: Despite short-term risks, many analysts consider Tesla a strong long-term play due to its innovation and brand strength.
Conclusion
The future of Tesla stock in 2025 is highly uncertain, with forecasts ranging from significant gains to steep declines. Key factors include delivery growth, technological breakthroughs, margin management, and competitive pressures. While the long-term outlook remains positive for many analysts, short-term risks and volatility should not be underestimated. Investors should monitor Tesla’s execution on new products, regulatory developments, and broader market trends for directional cues.

TESLA Stock Chart Fibonacci Analysis 042525Trading Idea
1) Find a FIBO slingshot
2) Check FIBO 61.80% level
3) Entry Point > 260/61.80%
Chart time frame: B
A) 15 min(1W-3M)
B) 1 hr(3M-6M)
C) 4 hr(6M-1year)
D) 1 day(1-3years)
Stock progress: A
A) Keep rising over 61.80% resistance
B) 61.80% resistance
C) 61.80% support
D) Hit the bottom
E) Hit the top
Stocks rise as they rise from support and fall from resistance. Our goal is to find a low support point and enter. It can be referred to as buying at the pullback point. The pullback point can be found with a Fibonacci extension of 61.80%. This is a step to find entry level. 1) Find a triangle (Fibonacci Speed Fan Line) that connects the high (resistance) and low (support) points of the stock in progress, where it is continuously expressed as a Slingshot, 2) and create a Fibonacci extension level for the first rising wave from the start point of slingshot pattern.
When the current price goes over 61.80% level , that can be a good entry point, especially if the SMA 100 and 200 curves are gathered together at 61.80%, it is a very good entry point.
As a great help, tradingview provides these Fibonacci speed fan lines and extension levels with ease. So if you use the Fibonacci fan line, the extension level, and the SMA 100/200 curve well, you can find an entry point for the stock market. At least you have to enter at this low point to avoid trading failure, and if you are skilled at entering this low point, with fibonacci6180 technique, your reading skill to chart will be greatly improved.
If you want to do day trading, please set the time frame to 5 minutes or 15 minutes, and you will see many of the low point of rising stocks.
If want to prefer long term range trading, you can set the time frame to 1 hr or 1 day.

Tesla 286,290 cross can create a stronger moveTesla 286,290 cross can create a stronger move. Tesla has been consolidating and is down 40%. With robotaxi and optimus, it is on the verge of breakout

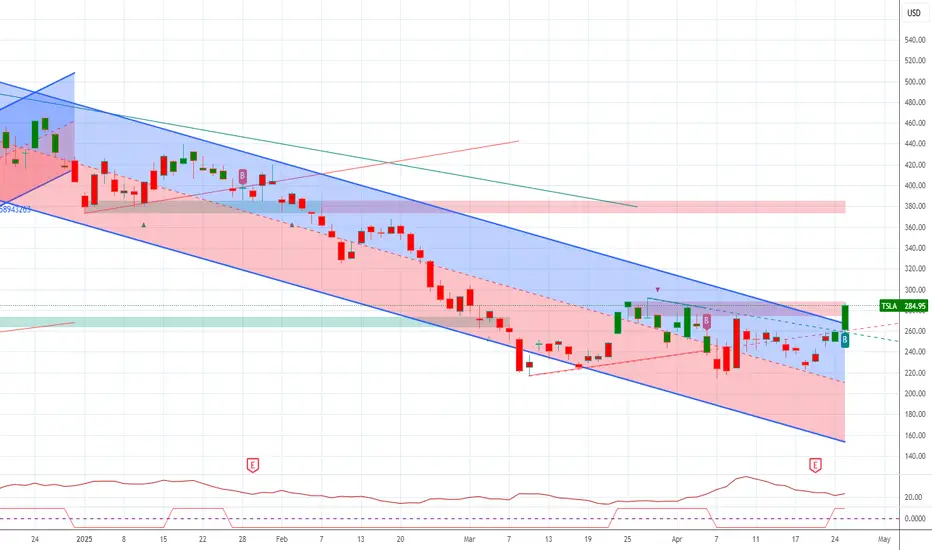
𝗧𝗲𝘀𝗹𝗮 𝗕𝗿𝗲𝗮𝗱𝗸𝗼𝘄𝗻: Priced for perfectionPriced for perfection in an imperfect market
NASDAQ:TSLA nearly hit its 200dma and key resistance area (~288–292) after a roughly 20% post-earnings squeeze, and as long as it stays below that level, it risks retesting the long-term uptrend line that has marked major lows twice since COVID.
𝘛𝘢𝘳𝘪𝘧𝘧 𝘢𝘯𝘥 𝘴𝘶𝘱𝘱𝘭𝘺-𝘤𝘩𝘢𝘪𝘯 𝘳𝘪𝘴𝘬: Tesla depends heavily on Chinese-made battery and electronic components now hit by reciprocal U.S. tariffs, while over 60% of global neodymium and dysprosium—vital for its EV motors—are mined and processed only in China, creating a critical bottleneck that could sharply elevate its input costs.
𝘔𝘢𝘳𝘨𝘪𝘯 𝘱𝘳𝘦𝘴𝘴𝘶𝘳𝘦 𝘷𝘴. 𝘭𝘰𝘧𝘵𝘺 𝘷𝘢𝘭𝘶𝘢𝘵𝘪𝘰𝘯: Q1 price cuts of up to 20% on core models drove Tesla’s auto gross margin to its lowest since 2020, calling into question the sustainability of its >70× forward P/E multiple, which assumes exceptionally high profits from future ventures like robotics and autonomous fleets.
$NQ_F NASDAQ:NDX NASDAQ:QQQ NASDAQ:AMZN NASDAQ:META NASDAQ:NVDA NASDAQ:SOX $ES_F AMEX:SPY SP:SPX TVC:DXY NASDAQ:TLT TVC:TNX TVC:VIX #Stocks #TrumpTariffs 🇺🇸 #ChinaTariffs 🇨🇳

TSLA LONG ~ All the technicals are there!TSLA will still hit $2600 ~ Says Cathie Wood
Will it? Let's take a look ~
ELON is pissing people off and investors are worried, Tarrif FUD, brand deterioration.
All of this doesn't matter
Why?
Pull up TSLA YoY earnings since 2013 and you will see that their revenue growth is outrageous, this past year is really the very first time TSLA flat lined, but holding at 25B revenue.
From a technical analysis since 2013 on the LOG chart, you can see TSLA has done a 10x rally twice, and has held strong support through it's bear cycles. The next it due by 2027.
TSLA has been uptrend for over a year, and broke it's ATH 6 months ago.
Voluming is rising in the longterm
and literally the conservatives love him,
If you think competitors are nipping at their heels think again. The infrastracture that Elon has built with his mega factories, and their positioning in the market is so insane other's don't even come close.
On the short term,
The FUD will wash away,
TSLA is finding support at the bottom of the channel,
shorterm volume is waning on the sell offs,
Shorts will get squeezed by end of June,
and Up and UP TSLA will continue.
BTFD!
