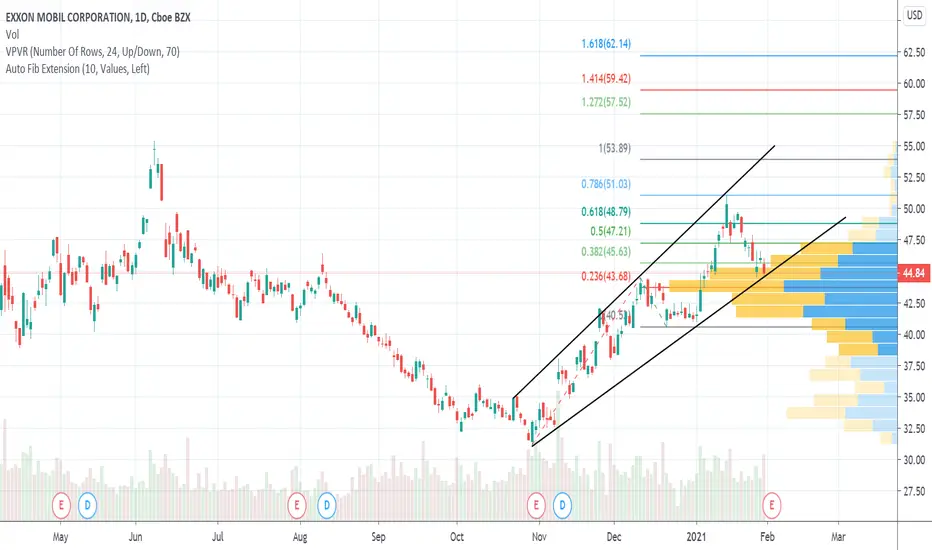
XOM, XOM, XOMWill XOM first do a little consolidation here in the channel before breakout, or will first make breakout and retesting before "touch the sky" on approx. 74,12 is up to see.
Time will show the right way.
* Support and resistance level are on monthly chart.
:)
NYSE:XOM
XOM trade ideas
Exxon Mobil broke out of the double bottom pattern with volumeNYSE:XOM broke out of the double bottom pattern. Any pullback is a buying opportunity, the stock is now targeting 79.76$, stop daily close below 50 MA.
Hit the like button and follow if you find this useful :)
This is only my own view and not financial advice, do your own analysis before buying or selling
Happy Trading!

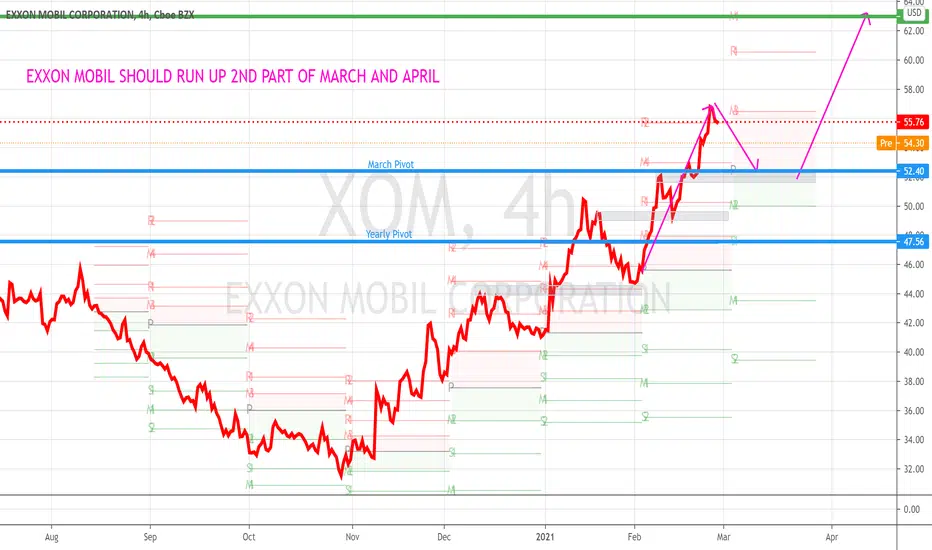
Exxon could be on for a big move given oil's big movementExxon has been moving a lot nicer then the asx stocks, and with oil punching above and closing above $66 on the weekly, oil share prices could be in for a decent move next week. Coincide this with the 1.9 trillion stimulus, i feel like a lot of money will be moved into commodities, especially oil. *as well as bitcoin, because its the future.* ;)
Ive never bought anything other then asx stocks, but i feel this could be a safe bet for the next few months with a stop loss at $54.

Quite the Run on XOMNot saying this one is "special" to me, but I think I will always remember the day on March 20 (three days before bottom) when I bought my first 9 shares of XOM at near 30$. Not sure where it goes, but I can see myself continuing to hodl my now 100 shares for a while. As always, I should have bought more while down there, but DCA as we've gone up and down has worked out to make this part of my portfolio. Fairly nice yield also at the prices that I've purchased.

Upward momentumIt seems large-cap grey beards are sustaining runs during this sell-off. Plausible third green day and breakout of the long-term upward wedge. 3/5 61 or 62c.


XOM Seasonal advanceOil is undervalued.
XOM is relatively strong compared to SHELL & BP.
XOM did not make a LL while SHELL & BP did.
Chevron is strongest and leading the way.
End March and April are seasonally bullish months for XOM.


head and shoulders bottomTrading an Inverse Head and Shoulders Conservatively
An investor can wait for the price to close above the neckline; this is effectively waiting for confirmation that the breakout is valid. Using this strategy, an investor can enter on the first close above the neckline. Alternatively, a limit order can be placed at or just below the broken neckline, attempting to get an execution on a retrace in price. Waiting for a retrace is likely to result in less slippage; however, there is the possibility of missing the trade if a pullback does not occur.


Short to 44.00Since Jan 14th XOM has been in a bearish direction. It closed at 47.44 which is also near 61.8% fib level. My idea is that it'll drop to 44.00. 44.00 being marked out from my fib extension tool as well as where my support zone is at. After it hits that price then it can make its way back into a bullish direction for the longterm.
If you agree with my analysis please like or comment your input.

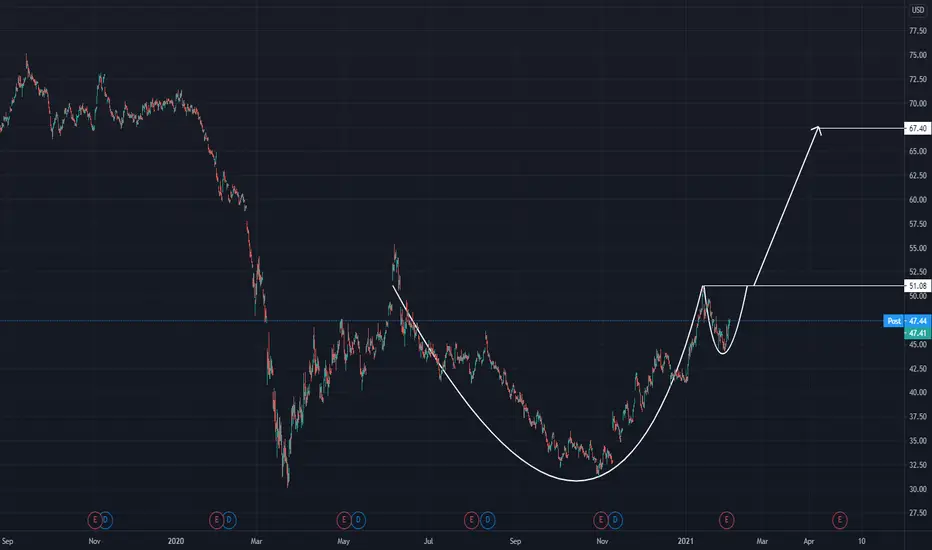

Exxon LT (February 2nd 2021)Exxon Mobil (XOM) (February 2nd 2021 through 2022)
Low: $32
High: $45
2020 Q4 announcements are in a few hours.
My assessment is as follows:
I believe the guidance could be reported as negative above all else.
I think EPS has a very slim chance to barely exceed analyst expectations of 1 cent, maybe 2 to 5 cents at the max, but I'm watching for it to end up being a really close call at around -2 or -3 cents too.
My original thought for my Cindicator forecast last night was that trading for the day could close positive but I think there's an even slimmer chance of that now that I've taken some more time to assess.
I think the current patterns could turn into a longer running contracting triangle, and it looks most like it will result in heavy bearish swings lower if it does finally break out in 2022, maybe as low as $23 to get started. I'd say its well known that oil is a dying industry and I believe it will reflect in the charts more and more as time goes on.
Thanks for tuning in :) Disclaimer, anyone in the trade needs to do their own due diligence and decide what is right for YOU. My charts can be wrong at any time and it's very important that you have your own strategies and plans in place. I run this channel for my own educational purposes of learning to trade, and I will never be 100% right, so please do not let me confirm any bias for you! (Dangerous to do so, stay safe and remember the basics & rules of risk assessment.) Expect the unexpected and happy trading!

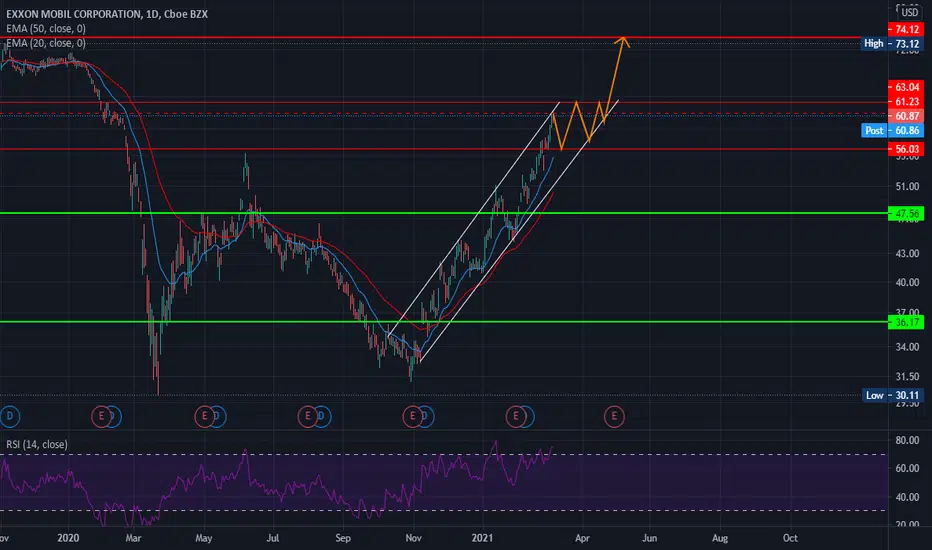
$XOM - solid r/r into earnings. Looking for $53.89Support on volume shelf with a decent upwards channel.