DAX 40 starts to show neutrality around the 22,000 levelThe German index has posted steady gains, rising nearly 7% over the last four trading sessions, mainly driven by the low interest rates maintained by the ECB at 2.25%, as well as the easing of potential trade war tensions, which has allowed the index’s bullish bias to remain strong in recent weeks. However, buying candles have been gradually diminishing over the last sessions, and it is likely that a selling candle may appear in today’s session, reinforcing short-term neutrality as the index trades above the 22,000 level.
Accelerated Trend: Since April 9, the DAX has shown significant upward movements, resulting in a fairly steep bullish slope and giving way to an accelerated uptrend. If the DAX fails to hold the recent weeks’ highs in the short term, this accelerated price movement could lead to corrective pullbacks. However, the dominant bias in the longer term remains bullish.
ADX: The ADX line has begun to decline and is now facing the neutral area marked around the 20 level. Frequent oscillations around this level indicate that volatility has decreased and could lead to sustained price neutrality in the short term.
MACD: The MACD histogram remains above the indicator’s 0 level but has shown a steady deceleration, which may signal a lack of momentum in the average movement of the moving averages. As the MACD histogram continues to narrow, it could pave the way for slight bearish momentum in the DAX’s daily chart over the short term.
Key levels to watch:
22,000 points: A nearby support area coinciding with an important psychological level, which could act as a significant barrier against potential short-term price pullbacks.
21,400 points: A distant support area aligning with the 100-period simple moving average. Bearish movements reaching this level could threaten the bullish formation currently seen on the chart.
23,000 points: A definitive resistance level coinciding with the area marked by the DAX’s all-time highs. Buying movements returning to this level could trigger a consistent bullish bias and a much more relevant uptrend in the short term.
Written by Julian Pineda, CFA – Market Analyst
DE40 trade ideas

DE40 / GER40 "Germany40" Index Market Heist Plan (Day Trade)🌟Hi! Hola! Ola! Bonjour! Hallo! Marhaba!🌟
Dear Money Makers & Robbers, 🤑 💰💸✈️
Based on 🔥Thief Trading style technical and fundamental analysis🔥, here is our master plan to heist the DE40 / GER40 "Germany40" Index Market Heist. Please adhere to the strategy I've outlined in the chart, which emphasizes long entry. Our aim is to escape near the high-risk ATR Line Zone. It's a Risky level, overbought market, consolidation, trend reversal, trap at the level where traders and bearish robbers are stronger. 🏆💸"Take profit and treat yourself, traders. You deserve it!💪🏆🎉
Entry 📈 : "The heist is on! Wait for the Crossing previous high (22600) then make your move - Bullish profits await!"
however I advise to Place Buy stop orders above the Moving average (or) Place buy limit orders within a 15 or 30 minute timeframe most recent or swing, low or high level for Pullback entries.
📌I strongly advise you to set an "alert (Alarm)" on your chart so you can see when the breakout entry occurs.
Stop Loss 🛑: "🔊 Yo, listen up! 🗣️ If you're lookin' to get in on a buy stop order, don't even think about settin' that stop loss till after the breakout 🚀. You feel me? Now, if you're smart, you'll place that stop loss where I told you to 📍, but if you're a rebel, you can put it wherever you like 🤪 - just don't say I didn't warn you ⚠️. You're playin' with fire 🔥, and it's your risk, not mine 👊."
📍 Thief SL placed at the nearest/swing low level Using the 4H timeframe (21700) Day trade basis.
📍 SL is based on your risk of the trade, lot size and how many multiple orders you have to take.
🏴☠️Target 🎯: 24000
🧲Scalpers, take note 👀 : only scalp on the Long side. If you have a lot of money, you can go straight away; if not, you can join swing traders and carry out the robbery plan. Use trailing SL to safeguard your money 💰.
💰💵💸DE40 / GER40 "Germany40" Index Money Heist is currently experiencing a bullishness,., driven by several key factors. .☝☝☝
⚠️Trading Alert : News Releases and Position Management 📰🗞️🚫🚏
As a reminder, news releases can have a significant impact on market prices and volatility. To minimize potential losses and protect your running positions,
we recommend the following:
Avoid taking new trades during news releases
Use trailing stop-loss orders to protect your running positions and lock in profits
💖Supporting our robbery plan 💥Hit the Boost Button💥 will enable us to effortlessly make and steal money 💰💵. Boost the strength of our robbery team. Every day in this market make money with ease by using the Thief Trading Style.🏆💪🤝❤️🎉🚀
I'll see you soon with another heist plan, so stay tuned 🤑🐱👤🤗🤩

Minor reversal before bullrun.Possible minor correction (wick) to fill the previous days gap then complete the started bull run from the OTE retracement. Possible ATH in sight.

Bullish rise off pullback support?GER40 has reacted off the support level which is a pullback support and could potentially rise from this level to our take profit.
Entry: 22,032.93
Why we like it:
There is a pullback support.
Stop loss: 21,497.17
Why we like it:
There is a pullback support.
Take profit: 23,476.82
Why we like it:
There is a pullback resistance.
Enjoying your TradingView experience? Review us!
Please be advised that the information presented on TradingView is provided to Vantage (‘Vantage Global Limited’, ‘we’) by a third-party provider (‘Everest Fortune Group’). Please be reminded that you are solely responsible for the trading decisions on your account. There is a very high degree of risk involved in trading. Any information and/or content is intended entirely for research, educational and informational purposes only and does not constitute investment or consultation advice or investment strategy. The information is not tailored to the investment needs of any specific person and therefore does not involve a consideration of any of the investment objectives, financial situation or needs of any viewer that may receive it. Kindly also note that past performance is not a reliable indicator of future results. Actual results may differ materially from those anticipated in forward-looking or past performance statements. We assume no liability as to the accuracy or completeness of any of the information and/or content provided herein and the Company cannot be held responsible for any omission, mistake nor for any loss or damage including without limitation to any loss of profit which may arise from reliance on any information supplied by Everest Fortune Group.

DAX WILL FALL|SHORT|
✅DAX has been growing recently
And the index seems locally overbought
So as the pair is approaching a horizontal resistance of 22,444
Price decline is to be expected
SHORT🔥
✅Like and subscribe to never miss a new idea!✅
Disclosure: I am part of Trade Nation's Influencer program and receive a monthly fee for using their TradingView charts in my analysis.

DE40 / GER40 "Germany40" Index Market Bullish Heist Plan🌟Hi! Hola! Ola! Bonjour! Hallo! Marhaba!🌟
Dear Money Makers & Robbers, 🤑 💰💸✈️
Based on 🔥Thief Trading style technical and fundamental analysis🔥, here is our master plan to heist the DE40 / GER40 "Germany40" Index Market. Please adhere to the strategy I've outlined in the chart, which emphasizes long entry. Our aim is to escape near the high-risk Red Zone Level. Risky level, overbought market, consolidation, trend reversal, trap at the level where traders and bearish robbers are stronger. 🏆💸"Take profit and treat yourself, traders. You deserve it!💪🏆🎉
Entry 📈 : "The vault is wide open! Swipe the Bullish loot at any price - the heist is on!
however I advise to Place buy limit orders within a 15 or 30 minute timeframe most recent or swing, low or high level. I Highly recommended you to put alert in your chart.
Stop Loss 🛑:
📍 Thief SL placed at the recent/swing low level Using the 4H timeframe (22250.0) Day/Swing trade basis.
📍 SL is based on your risk of the trade, lot size and how many multiple orders you have to take.
🏴☠️Target 🎯: 24700.0 (or) Escape Before the Target.
🧲Scalpers, take note 👀 : only scalp on the Long side. If you have a lot of money, you can go straight away; if not, you can join swing traders and carry out the robbery plan. Use trailing SL to safeguard your money 💰.
💰💵💸DE40 / GER40 "Germany40" Index Market Heist (Swing Trade Plan) is currently experiencing a neutral trend there is high chance for bullishness,., driven by several key factors. .☝☝☝
📰🗞️Get & Read the Fundamental, Macro economics, COT Report, Geopolitical and News Analysis, Sentimental Outlook, Intermarket Analysis, Index-Specific Analysis, Positioning and future trend targets with Overall Score..... go ahead to check👉👉👉🔗🔗🌎🌏🗺
⚠️Trading Alert : News Releases and Position Management 📰 🗞️ 🚫🚏
As a reminder, news releases can have a significant impact on market prices and volatility. To minimize potential losses and protect your running positions,
we recommend the following:
Avoid taking new trades during news releases
Use trailing stop-loss orders to protect your running positions and lock in profits
💖Supporting our robbery plan 💥Hit the Boost Button💥 will enable us to effortlessly make and steal money 💰💵. Boost the strength of our robbery team. Every day in this market make money with ease by using the Thief Trading Style.🏆💪🤝❤️🎉🚀
I'll see you soon with another heist plan, so stay tuned 🤑🐱👤🤗🤩

DAX INTRADAY uptrend continuationThe DAX40 continues to exhibit bullish sentiment, aligning with the prevailing short term uptrend. Recent price action suggests that the index experienced an oversold rally, which subsequently spiked above near a key resistance zone.
A corrective pullback to 22,826, followed by renewed buying pressure, would likely confirm a bullish reversal, with upside targets at:
23,730 – Near-term resistance
24,000 – Medium-term resistance
24,355 – Long-term resistance level
However, if price breaks and closes firmly below 22,826 on a daily basis, the bullish scenario would be invalidated. In that case, the DAX40 could extend corrective pullback toward:
22,500 – Immediate support
22,250 – Major downside target
Conclusion
The bias remains bullish above 22,826, with rallies from that level offering potential long opportunities. A daily close below 22,826, however, would shift sentiment and open the door for bearish continuation toward lower support levels.
This communication is for informational purposes only and should not be viewed as any form of recommendation as to a particular course of action or as investment advice. It is not intended as an offer or solicitation for the purchase or sale of any financial instrument or as an official confirmation of any transaction. Opinions, estimates and assumptions expressed herein are made as of the date of this communication and are subject to change without notice. This communication has been prepared based upon information, including market prices, data and other information, believed to be reliable; however, Trade Nation does not warrant its completeness or accuracy. All market prices and market data contained in or attached to this communication are indicative and subject to change without notice.

[DAX] Trade ideaThe EU indexes look better for now than the US indexes (and I am bullish on both of them).
For now the DAX is showing signs of bullish momentum for more after the breakout for a new ATH ... let's see ...
Great Trade !

DAX Wave Analysis – 6 May 2025
- DAX reversed from key resistance level 23435,00
- Likely to fall to support level 22700.00
DAX index recently reversed down from the key resistance level 23435,00 (which stopped the previous impulse wave (1) in the middle of March).
The resistance level 23435,00 was further strengthened by the upper daily Bollinger Band.
Given the strength of the resistance level 23435,00 and the overbought daily Stochastic, DAX index can be expected to fall to the next support level 22700.00.

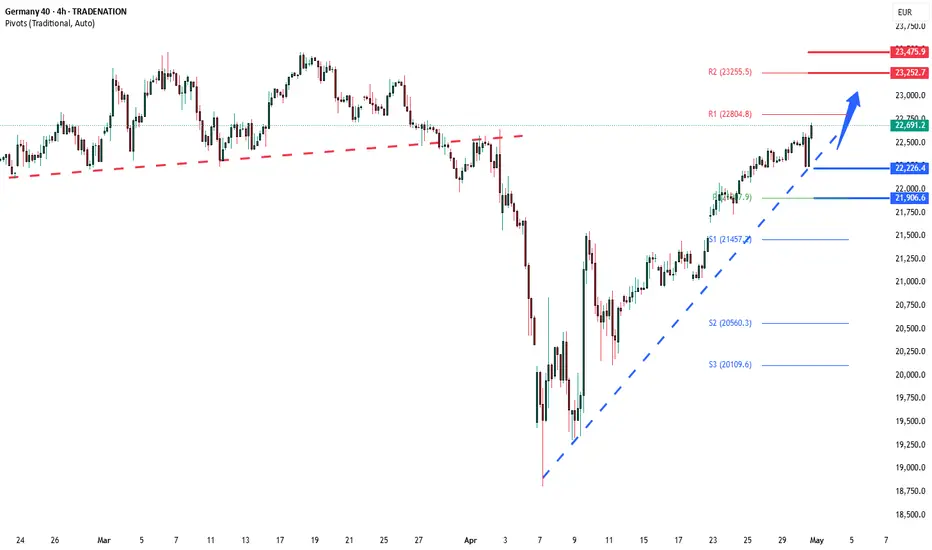
DAX40 INTRADAY supported at 22226The DAX40 continues to exhibit bullish sentiment, aligning with the prevailing short term uptrend. Recent price action suggests that the index experienced an oversold rally, which subsequently spiked above near a key resistance zone — the previous intraday consolidation level around 22,226.
This area now serves as a critical pivot point. A corrective pullback to 22,226, followed by renewed buying pressure, would likely confirm a bullish reversal, with upside targets at:
22,804 – Near-term resistance
23,252 – Medium-term resistance
23,475 – Long-term resistance level
However, if price breaks and closes firmly below 22,226 on a daily basis, the bullish scenario would be invalidated. In that case, the DAX40 could extend corrective pullback toward:
21,900 – Immediate support
20,457 – Major downside target
Conclusion
The bias remains bullish above 22,226, with rallies from that level offering potential long opportunities. A daily close below 22,226, however, would shift sentiment and open the door for bearish continuation toward lower support levels.
This communication is for informational purposes only and should not be viewed as any form of recommendation as to a particular course of action or as investment advice. It is not intended as an offer or solicitation for the purchase or sale of any financial instrument or as an official confirmation of any transaction. Opinions, estimates and assumptions expressed herein are made as of the date of this communication and are subject to change without notice. This communication has been prepared based upon information, including market prices, data and other information, believed to be reliable; however, Trade Nation does not warrant its completeness or accuracy. All market prices and market data contained in or attached to this communication are indicative and subject to change without notice.
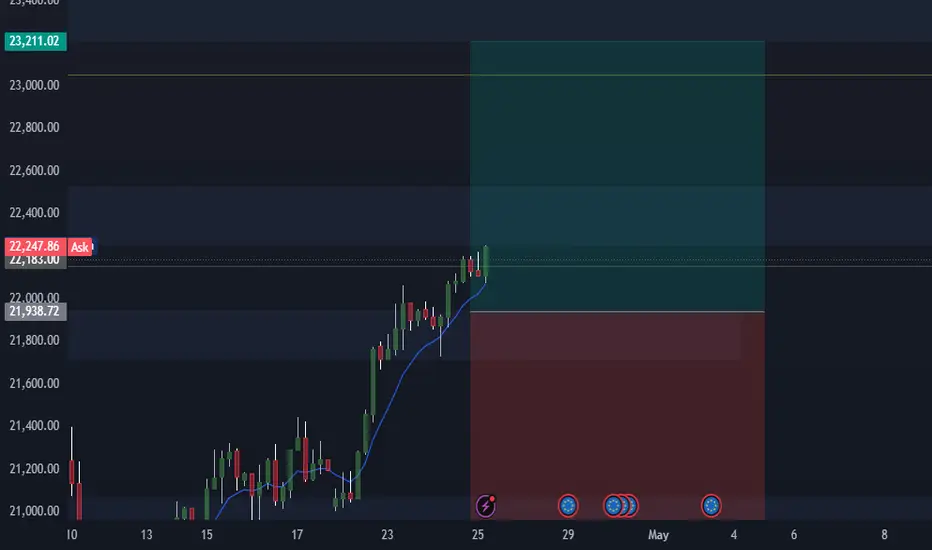
Bearish reversal?DAX40 (DE40) is rising towards the pivot which has been identified as a pullback resistance and could reverse to the 1st support which acts as a pullback support.
Pivot: 22,248.86
1st Support: 21,516.36
1st Resistance: 22,712.27
1st Resistance: 34.50
Risk Warning:
Trading Forex and CFDs carries a high level of risk to your capital and you should only trade with money you can afford to lose. Trading Forex and CFDs may not be suitable for all investors, so please ensure that you fully understand the risks involved and seek independent advice if necessary.
Disclaimer:
The above opinions given constitute general market commentary, and do not constitute the opinion or advice of IC Markets or any form of personal or investment advice.
Any opinions, news, research, analyses, prices, other information, or links to third-party sites contained on this website are provided on an "as-is" basis, are intended only to be informative, is not an advice nor a recommendation, nor research, or a record of our trading prices, or an offer of, or solicitation for a transaction in any financial instrument and thus should not be treated as such. The information provided does not involve any specific investment objectives, financial situation and needs of any specific person who may receive it. Please be aware, that past performance is not a reliable indicator of future performance and/or results. Past Performance or Forward-looking scenarios based upon the reasonable beliefs of the third-party provider are not a guarantee of future performance. Actual results may differ materially from those anticipated in forward-looking or past performance statements. IC Markets makes no representation or warranty and assumes no liability as to the accuracy or completeness of the information provided, nor any loss arising from any investment based on a recommendation, forecast or any information supplied by any third-party.

DAX Resistance Ahead! Sell!
Hello,Traders!
DAX is trading in a strong
Uptrend, recovering itself
From the trade-war lows
And the index is locally
Overbought so after the
Retest of the horizontal
Resistance above at 22,500
We will be expecting a local
Bearish correction
Sell!
Comment and subscribe to help us grow!
Check out other forecasts below too!
Disclosure: I am part of Trade Nation's Influencer program and receive a monthly fee for using their TradingView charts in my analysis.

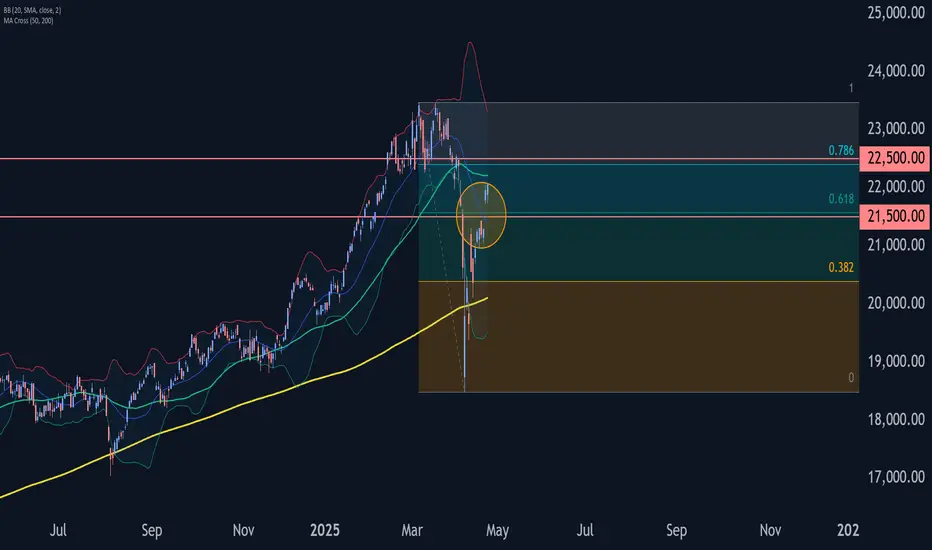
DAX Wave Analysis – 24 April 2025- DAX broke resistance area
- Likely to rise to resistance level 22500.00
DAX index is under the bullish pressure after it broke the resistance area between resistance level 21500.00 (top of the previous correction A) and the 61.8% Fibonacci correction of the downward ABC wave (2) from March.
The breakout of this resistance area accelerated the active impulse wave (3) from the start of April.
Given the clear daily uptrend, DAX index can be expected to rise toward the next resistance level 22500.00 (which stopped wave B of the earlier ABC wave (2)).
DAX enters major resistance zone after 3-day rallyThe DAX has enjoyed a very good recovery from its lows made earlier this month, outperforming many global indices. However, even the flying German index could be due a pullback now that it has reached a major resistance area.
As per the chart, the area between 21970 to 22240 marks a major zone. This area was previously a key support zone which gave way during the height of the tariffs uncertainty, paving the way for a sharp drop.
Now, with Trump changing his tone, we have seen European markets regain much of those losses. But the potential for the trade war to drag on is there, which is why we can't rule out the possibility of a fresh drop from around this area.
If the market does turn lower, then some of the key support levels to watch are drawn on the chart, with the first area for the bulls to defend coming in at around 21,500/50 (shaded in light blue).
By Fawad Razaqzada, market analyst with FOREX.com

DAX: Bears Are Winning! Short!
My dear friends,
Today we will analyse DAX together☺️
The price is near a wide key level
and the pair is approaching a significant decision level of 21,899.19 Therefore, a strong bearish reaction here could determine the next move down.We will watch for a confirmation candle, and then target the next key level of 21,455.49..Recommend Stop-loss is beyond the current level.
❤️Sending you lots of Love and Hugs❤️

DAX INTRADAY important support at 21118The DAX40 continues to exhibit bullish sentiment, aligning with the prevailing short term uptrend. Recent price action suggests that the index experienced an oversold rally, which subsequently spiked above near a key resistance zone — the previous intraday consolidation level around 21,532.
This area now serves as a critical pivot point. A corrective pullback “Gap Close” to 21,532, followed by renewed buying pressure, would likely confirm a bullish reversal, with upside targets at:
22,276 – Near-term resistance
22,657 – Medium-term resistance
22,903 – Long-term resistance level
However, if price breaks and closes firmly below 21,532 on a daily basis, the bullish scenario would be invalidated. In that case, the DAX40 could extend corrective pullback toward:
21,118 – Immediate support
20,800 – Major downside target
Conclusion
The bias remains bullish above 21,532, with rallies from that level offering potential long opportunities. A daily close below 21,532, however, would shift sentiment and open the door for bearish continuation toward lower support levels.
This communication is for informational purposes only and should not be viewed as any form of recommendation as to a particular course of action or as investment advice. It is not intended as an offer or solicitation for the purchase or sale of any financial instrument or as an official confirmation of any transaction. Opinions, estimates and assumptions expressed herein are made as of the date of this communication and are subject to change without notice. This communication has been prepared based upon information, including market prices, data and other information, believed to be reliable; however, Trade Nation does not warrant its completeness or accuracy. All market prices and market data contained in or attached to this communication are indicative and subject to change without notice.

Order Block on lower time frame.A short rally to the upside is expected, after an order block on the lower time. If the target is reached and the price closes on the 15m candle above the OB line, we may see a bigger push to the up side.

DAX H1 | Potential bullish bounce?DAX (GER30) is falling towards a pullback support and could potentially bounce off this level to climb higher.
Buy entry is at 21,467.75 which is a pullback support that aligns close to the 23.6% Fibonacci retracement.
Stop loss is at 21,000.00 which is a level that lies underneath an overlap support.
Take profit is at 22,576.90 which is a swing-high resistance.
High Risk Investment Warning
Trading Forex/CFDs on margin carries a high level of risk and may not be suitable for all investors. Leverage can work against you.
Stratos Markets Limited (tradu.com):
CFDs are complex instruments and come with a high risk of losing money rapidly due to leverage. 63% of retail investor accounts lose money when trading CFDs with this provider. You should consider whether you understand how CFDs work and whether you can afford to take the high risk of losing your money.
Stratos Europe Ltd (tradu.com):
CFDs are complex instruments and come with a high risk of losing money rapidly due to leverage. 63% of retail investor accounts lose money when trading CFDs with this provider. You should consider whether you understand how CFDs work and whether you can afford to take the high risk of losing your money.
Stratos Global LLC (tradu.com):
Losses can exceed deposits.
Please be advised that the information presented on TradingView is provided to Tradu (‘Company’, ‘we’) by a third-party provider (‘TFA Global Pte Ltd’). Please be reminded that you are solely responsible for the trading decisions on your account. There is a very high degree of risk involved in trading. Any information and/or content is intended entirely for research, educational and informational purposes only and does not constitute investment or consultation advice or investment strategy. The information is not tailored to the investment needs of any specific person and therefore does not involve a consideration of any of the investment objectives, financial situation or needs of any viewer that may receive it. Kindly also note that past performance is not a reliable indicator of future results. Actual results may differ materially from those anticipated in forward-looking or past performance statements. We assume no liability as to the accuracy or completeness of any of the information and/or content provided herein and the Company cannot be held responsible for any omission, mistake nor for any loss or damage including without limitation to any loss of profit which may arise from reliance on any information supplied by TFA Global Pte Ltd.
The speaker(s) is neither an employee, agent nor representative of Tradu and is therefore acting independently. The opinions given are their own, constitute general market commentary, and do not constitute the opinion or advice of Tradu or any form of personal or investment advice. Tradu neither endorses nor guarantees offerings of third-party speakers, nor is Tradu responsible for the content, veracity or opinions of third-party speakers, presenters or participants.

Bullish rise?DAX40 (DE40) is falling towards the pivot which acts as a pullback support and could bounce to the 1st resistance.
Pivot: 21,505.00
1st Support: 20,817.80
1st Resistance: 22,723.90
Risk Warning:
Trading Forex and CFDs carries a high level of risk to your capital and you should only trade with money you can afford to lose. Trading Forex and CFDs may not be suitable for all investors, so please ensure that you fully understand the risks involved and seek independent advice if necessary.
Disclaimer:
The above opinions given constitute general market commentary, and do not constitute the opinion or advice of IC Markets or any form of personal or investment advice.
Any opinions, news, research, analyses, prices, other information, or links to third-party sites contained on this website are provided on an "as-is" basis, are intended only to be informative, is not an advice nor a recommendation, nor research, or a record of our trading prices, or an offer of, or solicitation for a transaction in any financial instrument and thus should not be treated as such. The information provided does not involve any specific investment objectives, financial situation and needs of any specific person who may receive it. Please be aware, that past performance is not a reliable indicator of future performance and/or results. Past Performance or Forward-looking scenarios based upon the reasonable beliefs of the third-party provider are not a guarantee of future performance. Actual results may differ materially from those anticipated in forward-looking or past performance statements. IC Markets makes no representation or warranty and assumes no liability as to the accuracy or completeness of the information provided, nor any loss arising from any investment based on a recommendation, forecast or any information supplied by any third-party.

GERMANY 30 LONG looking at continuation of current buy trend on Germany 30... Tell me what you think

DAX40 INTRADAY “gap breakout” supported at 21532The DAX40 continues to exhibit bullish sentiment, aligning with the prevailing short term uptrend. Recent price action suggests that the index experienced an oversold rally, which subsequently spiked above near a key resistance zone — the previous intraday consolidation level around 21,532.
This area now serves as a critical pivot point. A corrective pullback “Gap Close” to 21,532, followed by renewed buying pressure, would likely confirm a bullish reversal, with upside targets at:
22,276 – Near-term resistance
22,657 – Medium-term resistance
22,903 – Long-term resistance level
However, if price breaks and closes firmly below 21,532 on a daily basis, the bullish scenario would be invalidated. In that case, the DAX40 could extend corrective pullback toward:
21,118 – Immediate support
20,800 – Major downside target
Conclusion
The bias remains bullish above 21,532, with rallies from that level offering potential long opportunities. A daily close below 21,532, however, would shift sentiment and open the door for bearish continuation toward lower support levels.
This communication is for informational purposes only and should not be viewed as any form of recommendation as to a particular course of action or as investment advice. It is not intended as an offer or solicitation for the purchase or sale of any financial instrument or as an official confirmation of any transaction. Opinions, estimates and assumptions expressed herein are made as of the date of this communication and are subject to change without notice. This communication has been prepared based upon information, including market prices, data and other information, believed to be reliable; however, Trade Nation does not warrant its completeness or accuracy. All market prices and market data contained in or attached to this communication are indicative and subject to change without notice.

Ger40 dax SeekingPips short SELL UP here hight Reward to Risk🌟Good morning ladies and gentlemen.🌟
I like the Reward to Risk profile on this setup over 7r ✅️
Although it's one of my lower win rate strategies it's a simple set and forget trade setup with the statistics to backbup my plan.
🟢SeekingPips🟢 is short with Stop Loss above the highest high this morning.
On the feed that I am using that high 21839.5
I'M LOOKING for a GAP FILL🚥
