Bearish reversal off pullback resistance?DAX40 (DE40) is rising towards the pivot which has been identified as a pullback resistance and could reverse to the 1st support.
Pivot: 22,166.64
1st Support: 21,307.07
1st Resistance: 22,712.27
Risk Warning:
Trading Forex and CFDs carries a high level of risk to your capital and you should only trade with money you can afford to lose. Trading Forex and CFDs may not be suitable for all investors, so please ensure that you fully understand the risks involved and seek independent advice if necessary.
Disclaimer:
The above opinions given constitute general market commentary, and do not constitute the opinion or advice of IC Markets or any form of personal or investment advice.
Any opinions, news, research, analyses, prices, other information, or links to third-party sites contained on this website are provided on an "as-is" basis, are intended only to be informative, is not an advice nor a recommendation, nor research, or a record of our trading prices, or an offer of, or solicitation for a transaction in any financial instrument and thus should not be treated as such. The information provided does not involve any specific investment objectives, financial situation and needs of any specific person who may receive it. Please be aware, that past performance is not a reliable indicator of future performance and/or results. Past Performance or Forward-looking scenarios based upon the reasonable beliefs of the third-party provider are not a guarantee of future performance. Actual results may differ materially from those anticipated in forward-looking or past performance statements. IC Markets makes no representation or warranty and assumes no liability as to the accuracy or completeness of the information provided, nor any loss arising from any investment based on a recommendation, forecast or any information supplied by any third-party.
DE40 trade ideas

Technical Analysis WeeklyStart your week by identifying the key price levels and trends.
The SpreadEx Research team has analysed the most popular markets, including stocks, indices, commodities & forex.
--------------------------------------------------------------------------------------------------------------
Analysis
Germany 40 remains in a bearish trend but is currently undergoing a prolonged correction. It’s trading at 21,122, hovering just around its 20-day VWAP of 21,120. The RSI reads 47, suggesting a stabilisation in momentum. Support is found at 19,360, while resistance sits higher at 22,687.
UK 100 is in a bearish correction phase, trading at 8,293, back over its VWAP of 8071. RSI at 50 indicates neutral momentum. Support lies at 7,509, while resistance is overhead at 8,633.
Wall Street continues to correct within a broader bearish context. Currently priced at 38,588, it's just below its VWAP of 40,901. With an RSI of 40.8, momentum remains on the weak side. Support is seen at 37,161, while resistance looms near 43,021.
Brent Crude is correcting within a bearish trend, trading at 6,621—just below its VWAP of 6,691. RSI at 45.7 reflects subdued momentum. Support is found at 5,903, while resistance remains a stretch away at 7,479.
Gold maintains its bullish impulsive trend, pushing to fresh highs at 3,446. It is trading well above its VWAP of 3,446, confirming the strong trend. The RSI at 78.3 places it firmly in overbought territory, signalling powerful momentum but also increased risk of sudden turnaround. Support is marked at 2,893, while resistance now matches the current price.
The weak US dollar means EUR/USD is advancing in a bullish impulsive move, now at 1.1465, trading comfortably above the VWAP of 1.1137. RSI stands at 70.2, suggesting overbought conditions may limit further upside short term. Support lies at 1.0633, with resistance at
GBP/USD is climbing steadily in an impulsive bullish phase, priced at 1.3368 and trading above the VWAP of 1.3051. The RSI of 72.1 indicates overbought territory. Support is seen at 1.2653, while resistance is just ahead at 1.3448.
USD/JPY remains in a bearish impulsive trend, currently at 140.66 and well beneath its VWAP of 145.17. RSI at 30.7 puts it right on the edge of oversold territory. Support is nearby at 139.11, while resistance sits at 151.23.

Potential bearish reversal?GER40 is rising towards the resistance level which is a pullback resistance and could drop from this level to our take profit.
Entry: 21,545.11
Why we like it:
There is a pullback resistance level.
Stop loss: 22,174.31
Why we like it:
There is a pullback resistance level that lines up with the 138.2% Fibonacci extension.
Take profit: 20,327.32
Why we like it:
There is a pullback support level.
Enjoying your TradingView experience? Review us!
Please be advised that the information presented on TradingView is provided to Vantage (‘Vantage Global Limited’, ‘we’) by a third-party provider (‘Everest Fortune Group’). Please be reminded that you are solely responsible for the trading decisions on your account. There is a very high degree of risk involved in trading. Any information and/or content is intended entirely for research, educational and informational purposes only and does not constitute investment or consultation advice or investment strategy. The information is not tailored to the investment needs of any specific person and therefore does not involve a consideration of any of the investment objectives, financial situation or needs of any viewer that may receive it. Kindly also note that past performance is not a reliable indicator of future results. Actual results may differ materially from those anticipated in forward-looking or past performance statements. We assume no liability as to the accuracy or completeness of any of the information and/or content provided herein and the Company cannot be held responsible for any omission, mistake nor for any loss or damage including without limitation to any loss of profit which may arise from reliance on any information supplied by Everest Fortune Group.

DAX: Move Down Expected! Short!
My dear friends,
Today we will analyse DAXtogether☺️
The price is near a wide key level
and the pair is approaching a significant decision level of 21,196.29 Therefore, a strong bearish reaction here could determine the next move down.We will watch for a confirmation candle, and then target the next key level of 21,007.25..Recommend Stop-loss is beyond the current level.
❤️Sending you lots of Love and Hugs❤️

"GERMANY 40" Index CFD Market Heist Plan (Day / Swing Trade)🌟Hi! Hola! Ola! Bonjour! Hallo! Marhaba!🌟
Dear Money Makers & Robbers, 🤑💰✈️
Based on 🔥Thief Trading style technical and fundamental analysis🔥, here is our master plan to heist the "GERMANY 40" Index CFD Market. Please adhere to the strategy I've outlined in the chart, which emphasizes short entry. Our aim is the high-risk Green MA Zone. Risky level, oversold market, consolidation, trend reversal, trap at the level where traders and bullish robbers are stronger. 🏆💸"Take profit and treat yourself, traders. You deserve it!💪🏆🎉
Entry 📈 : "The vault is wide open! Swipe the Bearish loot at any price - the heist is on!
however I advise to Place sell limit orders within a 15 or 30 minute timeframe most nearest or swing, low or high level for Pullback Entries.
Stop Loss 🛑:
📌Thief SL placed at the nearest/swing High or Low level Using the 4H timeframe (20500) Day/Swing trade basis.
📌SL is based on your risk of the trade, lot size and how many multiple orders you have to take.
Target 🎯: 18400 (or) Escape Before the Target
"GERMANY 40" Index CFD Market Heist Plan (Swing/Day Trade) is currently experiencing a Bearish trend.., driven by several key factors.👇👇👇
📰🗞️Get & Read the Fundamental, Macro, COT Report, Geopolitical and News Analysis, Sentimental Outlook, Intermarket Analysis, Index-Specific Analysis, Positioning and future trend targets... go ahead to check 👉👉👉🔗🔗
⚠️Trading Alert : News Releases and Position Management 📰 🗞️ 🚫🚏
As a reminder, news releases can have a significant impact on market prices and volatility. To minimize potential losses and protect your running positions,
we recommend the following:
Avoid taking new trades during news releases
Use trailing stop-loss orders to protect your running positions and lock in profits
💖Supporting our robbery plan 💥Hit the Boost Button💥 will enable us to effortlessly make and steal money 💰💵. Boost the strength of our robbery team. Every day in this market make money with ease by using the Thief Trading Style.🏆💪🤝❤️🎉🚀
I'll see you soon with another heist plan, so stay tuned 🤑🐱👤🤗🤩

[DAX] Trade ideaNew idea for the next week with a downside move possibility.
Waiting for more confirmation to enter after break of trendline can be great and the open will be decisive.
Great Trade !

Bullish bounce?DAX40 (DE40) is falling towards the pivot which acts as a pullback support and could bounce to the 1st resistance which has been identified as a pullback resistance.
Pivot: 20,786.83
1st Support: 20,370.22
1st Resistance: 21,784.20
Risk Warning:
Trading Forex and CFDs carries a high level of risk to your capital and you should only trade with money you can afford to lose. Trading Forex and CFDs may not be suitable for all investors, so please ensure that you fully understand the risks involved and seek independent advice if necessary.
Disclaimer:
The above opinions given constitute general market commentary, and do not constitute the opinion or advice of IC Markets or any form of personal or investment advice.
Any opinions, news, research, analyses, prices, other information, or links to third-party sites contained on this website are provided on an "as-is" basis, are intended only to be informative, is not an advice nor a recommendation, nor research, or a record of our trading prices, or an offer of, or solicitation for a transaction in any financial instrument and thus should not be treated as such. The information provided does not involve any specific investment objectives, financial situation and needs of any specific person who may receive it. Please be aware, that past performance is not a reliable indicator of future performance and/or results. Past Performance or Forward-looking scenarios based upon the reasonable beliefs of the third-party provider are not a guarantee of future performance. Actual results may differ materially from those anticipated in forward-looking or past performance statements. IC Markets makes no representation or warranty and assumes no liability as to the accuracy or completeness of the information provided, nor any loss arising from any investment based on a recommendation, forecast or any information supplied by any third-party.

25-04-16 DAY 21'196 - More to come ..Bears comin'The German Dax did last year a very outstanding performance.
Inbetween, some money switches from the USA into Europe. Germany as well.
The Chart shows very impressive, what 2001 happend. Also after a period, where everyone talked about "the Sky" is the Limit. After 2001 the Dax needed 5 years for revovering.
Germany actually stands for big problems:
. the new coaltition between CDU and SPD ist called the "Schuko" means "Schuldenkoaliation"
. immense cost for socialising all the refugees, since years and no way out to see
. Automobile Industrie in big problems, means 25% of the germans manufactoring sector
. Toll will come and net profit and Dividends will hammered down, first quarter will show
. P/E still 40%-50 over long term average of 15.
So, all in all. Keep away from the DAX, for a long time.

DAX INTRADAY decision point at 21520The DAX40 continues to exhibit bearish sentiment, aligning with the prevailing downward trend. Recent price action suggests that the index experienced an oversold rally, which was subsequently rejected near a key resistance zone — the previous intraday consolidation level around 21,520.
This area now serves as a critical pivot point. A failure to break above 21,520, followed by renewed selling pressure, would likely confirm a bearish reversal, with downside targets at:
20,333 – Near-term support
19,557 – Medium-term support
18,780 – Long-term support level
However, if price breaks and closes firmly above 21,520 on a daily basis, the bearish scenario would be invalidated. In that case, the DAX40 could extend gains toward:
21,880 – Immediate resistance
22,330 – Major upside target
Conclusion
The bias remains bearish below 21,520, with rallies into that level offering potential short opportunities. A daily close above 21,520, however, would shift sentiment and open the door for bullish continuation toward higher resistance levels.
This communication is for informational purposes only and should not be viewed as any form of recommendation as to a particular course of action or as investment advice. It is not intended as an offer or solicitation for the purchase or sale of any financial instrument or as an official confirmation of any transaction. Opinions, estimates and assumptions expressed herein are made as of the date of this communication and are subject to change without notice. This communication has been prepared based upon information, including market prices, data and other information, believed to be reliable; however, Trade Nation does not warrant its completeness or accuracy. All market prices and market data contained in or attached to this communication are indicative and subject to change without notice.

GER30 BULLISHI'm back again with nice setup ger30 is bullish until resistance level up we go no looking back.

DAX: Move Up Expected! Long!
My dear friends,
Today we will analyse DAX together☺️
The recent price action suggests a shift in mid-term momentum. A break below the current local range around 21,159.51 will confirm the new direction downwards with the target being the next key level of 21,322.13.and a reconvened placement of a stop-loss beyond the range.
❤️Sending you lots of Love and Hugs❤️

Will 20954 be the next target ?I think that the price of the GDAXI might go to 20954 (Buy side liquidity).

DAX H4 | Rising into a swing-high resistanceThe DAX (GER30) is rising towards a swing-high resistance and could potentially reverse off this level to drop lower.
Sell entry is at 21,467.75 which is a swing-high resistance.
Stop loss is at 22,200.00 which is a level that sits above a pullback resistance.
Take profit is at 20,283.76 which is an overlap support that aligns with the 50.0% Fibonacci retracement.
High Risk Investment Warning
Trading Forex/CFDs on margin carries a high level of risk and may not be suitable for all investors. Leverage can work against you.
Stratos Markets Limited (tradu.com):
CFDs are complex instruments and come with a high risk of losing money rapidly due to leverage. 63% of retail investor accounts lose money when trading CFDs with this provider. You should consider whether you understand how CFDs work and whether you can afford to take the high risk of losing your money.
Stratos Europe Ltd (tradu.com):
CFDs are complex instruments and come with a high risk of losing money rapidly due to leverage. 63% of retail investor accounts lose money when trading CFDs with this provider. You should consider whether you understand how CFDs work and whether you can afford to take the high risk of losing your money.
Stratos Global LLC (tradu.com):
Losses can exceed deposits.
Please be advised that the information presented on TradingView is provided to Tradu (‘Company’, ‘we’) by a third-party provider (‘TFA Global Pte Ltd’). Please be reminded that you are solely responsible for the trading decisions on your account. There is a very high degree of risk involved in trading. Any information and/or content is intended entirely for research, educational and informational purposes only and does not constitute investment or consultation advice or investment strategy. The information is not tailored to the investment needs of any specific person and therefore does not involve a consideration of any of the investment objectives, financial situation or needs of any viewer that may receive it. Kindly also note that past performance is not a reliable indicator of future results. Actual results may differ materially from those anticipated in forward-looking or past performance statements. We assume no liability as to the accuracy or completeness of any of the information and/or content provided herein and the Company cannot be held responsible for any omission, mistake nor for any loss or damage including without limitation to any loss of profit which may arise from reliance on any information supplied by TFA Global Pte Ltd.
The speaker(s) is neither an employee, agent nor representative of Tradu and is therefore acting independently. The opinions given are their own, constitute general market commentary, and do not constitute the opinion or advice of Tradu or any form of personal or investment advice. Tradu neither endorses nor guarantees offerings of third-party speakers, nor is Tradu responsible for the content, veracity or opinions of third-party speakers, presenters or participants.

DAX IMPORTANT resistance retest at 21520? The DAX40 continues to exhibit bearish sentiment, aligning with the prevailing downward trend. Recent price action suggests that the index experienced an oversold rally, which was subsequently rejected near a key resistance zone — the previous intraday consolidation level around 21,520.
This area now serves as a critical pivot point. A failure to break above 21,520, followed by renewed selling pressure, would likely confirm a bearish reversal, with downside targets at:
20,333 – Near-term support
19,557 – Medium-term support
18,780 – Long-term support level
However, if price breaks and closes firmly above 21,520 on a daily basis, the bearish scenario would be invalidated. In that case, the DAX40 could extend gains toward:
21,880 – Immediate resistance
22,330 – Major upside target
Conclusion
The bias remains bearish below 21,520, with rallies into that level offering potential short opportunities. A daily close above 21,520, however, would shift sentiment and open the door for bullish continuation toward higher resistance levels.
This communication is for informational purposes only and should not be viewed as any form of recommendation as to a particular course of action or as investment advice. It is not intended as an offer or solicitation for the purchase or sale of any financial instrument or as an official confirmation of any transaction. Opinions, estimates and assumptions expressed herein are made as of the date of this communication and are subject to change without notice. This communication has been prepared based upon information, including market prices, data and other information, believed to be reliable; however, Trade Nation does not warrant its completeness or accuracy. All market prices and market data contained in or attached to this communication are indicative and subject to change without notice.

ger30 bullishger30 is about to buy up we without looking back, break and retest, bullish until resistance level.

Technical Analysis WeeklyStart your week by identifying the key price levels and trends.
The SpreadEx Research team has analysed the most popular markets, including stocks, indices, commodities & forex.
--------------------------------------------------------------------------------------------------------------
Analysis
Germany 40 remains in a bearish market but has entered a correction following last week’s big turnaround. It is trading at 20,805, still below its 20-day VWAP of 21,478. The RSI at 43 suggests weak momentum, but not extreme oversold conditions. Support is in place at 19,120, while a breakout above resistance at 23,836 would be needed to challenge the current trend.
UK 100 is in a bearish correction phase, hovering at 8,105 and just under the VWAP of 8,147. With an RSI of 42, momentum remains muted but no longer extremely weak. Support is seen at 7,428, and resistance looms at 8,865.
Wall Street continues to correct within a broader bearish trend. It trades at 40,409, slightly below the VWAP of 40,734. RSI at 48 indicates neutral momentum, showing signs of consolidation. Key support is found at 37,241, while resistance stands at 44,228.
Brent Crude is in a bearish impulsive move, with price down to 6,445, firmly beneath the VWAP of 6,895. RSI at 39 signals persistent bearish pressure. Immediate support lies at 5,964, and resistance caps upside potential way back up at 7,826.
Gold continues to show strength, advancing in an impulsive bullish trend to yet more record highs. It trades at 3,231, above its VWAP of 3,084. The RSI at 69 places it just shy of overbought levels, suggesting momentum remains strong. Support rests at 2,921, while resistance is close at 3,231.
EUR/USD is surging in a bullish impulsive phase, trading at 1.1392 and significantly above its VWAP of 1.0955. RSI is elevated at 75, indicating overbought territory and scope for some kind of consolidation. Support is located at 1.0543, and price is currently testing resistance at 1.1392.
GBP/USD continues its impulsive bullish move, currently trading at 1.3130, just above the VWAP of 1.2940. RSI at 63 reflects solid bullish momentum. Support sits at 1.2733, while resistance coincides with the current high at 1.3130.
USD/JPY is in a bearish impulsive move, trading at 142.73, beneath the VWAP of 147.65. The RSI at 34 suggests weakening momentum, close to oversold but not extreme. Support is nearby at 142.43, with resistance up at 153.06.

DAX H4 | Swing-high resistance overheadThe DAX (GER30) is rising towards a swing-high resistance and could potentially reverse off this level to drop lower.
Sell entry is at 21,467.75 which is a swing-high resistance.
Stop loss is at 22,100.00 which is a level that sits above a pullback resistance.
Take profit is at 20,318.67 which is an overlap support that aligns close to the 61.8% Fibonacci retracement.
High Risk Investment Warning
Trading Forex/CFDs on margin carries a high level of risk and may not be suitable for all investors. Leverage can work against you.
Stratos Markets Limited (tradu.com):
CFDs are complex instruments and come with a high risk of losing money rapidly due to leverage. 63% of retail investor accounts lose money when trading CFDs with this provider. You should consider whether you understand how CFDs work and whether you can afford to take the high risk of losing your money.
Stratos Europe Ltd (tradu.com):
CFDs are complex instruments and come with a high risk of losing money rapidly due to leverage. 63% of retail investor accounts lose money when trading CFDs with this provider. You should consider whether you understand how CFDs work and whether you can afford to take the high risk of losing your money.
Stratos Global LLC (tradu.com):
Losses can exceed deposits.
Please be advised that the information presented on TradingView is provided to Tradu (‘Company’, ‘we’) by a third-party provider (‘TFA Global Pte Ltd’). Please be reminded that you are solely responsible for the trading decisions on your account. There is a very high degree of risk involved in trading. Any information and/or content is intended entirely for research, educational and informational purposes only and does not constitute investment or consultation advice or investment strategy. The information is not tailored to the investment needs of any specific person and therefore does not involve a consideration of any of the investment objectives, financial situation or needs of any viewer that may receive it. Kindly also note that past performance is not a reliable indicator of future results. Actual results may differ materially from those anticipated in forward-looking or past performance statements. We assume no liability as to the accuracy or completeness of any of the information and/or content provided herein and the Company cannot be held responsible for any omission, mistake nor for any loss or damage including without limitation to any loss of profit which may arise from reliance on any information supplied by TFA Global Pte Ltd.
The speaker(s) is neither an employee, agent nor representative of Tradu and is therefore acting independently. The opinions given are their own, constitute general market commentary, and do not constitute the opinion or advice of Tradu or any form of personal or investment advice. Tradu neither endorses nor guarantees offerings of third-party speakers, nor is Tradu responsible for the content, veracity or opinions of third-party speakers, presenters or participants.

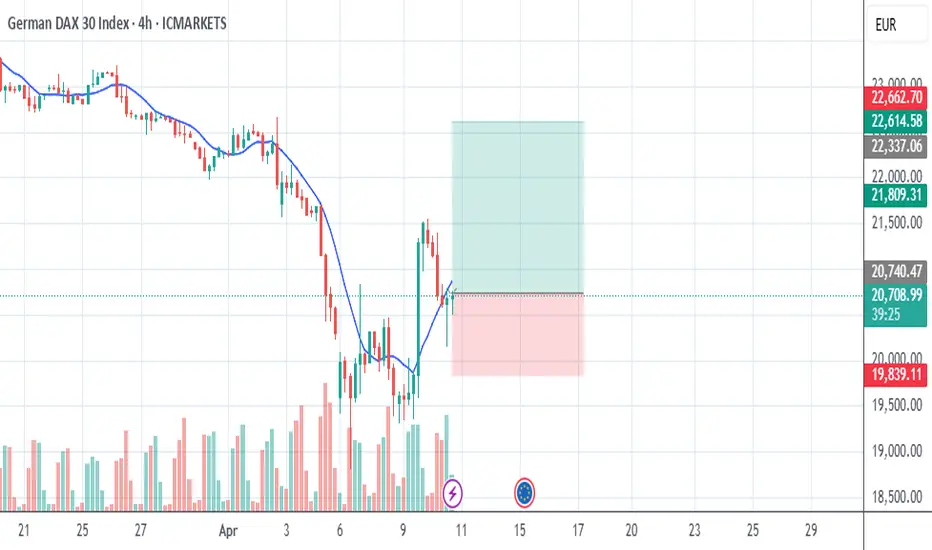
Bullish bounce off pullback support?GER40 has bounced off the support level which is a pullback support that lines up with the 5-% Fibonacci retracement and could rise from this level to our take profit.
Entry: 20,283,82
Why we like it:
There is a pullback support level that lines up with the 50% Fibonacci retracement.
Stop loss: 19,359.58
Why we like it:
There is a pullback support level.
Take profit: 21,468.60
Why we like it:
There is a pullback resistance level.
Enjoying your TradingView experience? Review us!
Please be advised that the information presented on TradingView is provided to Vantage (‘Vantage Global Limited’, ‘we’) by a third-party provider (‘Everest Fortune Group’). Please be reminded that you are solely responsible for the trading decisions on your account. There is a very high degree of risk involved in trading. Any information and/or content is intended entirely for research, educational and informational purposes only and does not constitute investment or consultation advice or investment strategy. The information is not tailored to the investment needs of any specific person and therefore does not involve a consideration of any of the investment objectives, financial situation or needs of any viewer that may receive it. Kindly also note that past performance is not a reliable indicator of future results. Actual results may differ materially from those anticipated in forward-looking or past performance statements. We assume no liability as to the accuracy or completeness of any of the information and/or content provided herein and the Company cannot be held responsible for any omission, mistake nor for any loss or damage including without limitation to any loss of profit which may arise from reliance on any information supplied by Everest Fortune Group.

DAX: Next Move Is Up! Long!
My dear friends,
Today we will analyse DAX together☺️
The price is near a wide key level
and the pair is approaching a significant decision level of 20.353.80 Therefore, a strong bullish reaction here could determine the next move up.We will watch for a confirmation candle, and then target the next key level of 21.097.51.Recommend Stop-loss is beyond the current level.
❤️Sending you lots of Love and Hugs❤️

Make German Index Great Again? DAX Moves in Silence While the World Screams 📊⚡
It’s loud out there — tariffs flying, currencies shifting, old alliances shaking.
We’ve got Trump hinting at tariffs against U.S. allies and China, the Euro flexing, the dollar facing devaluation talk, and a tangled mess of energy politics with Russia and Germany in the middle. All of this creates layers of macro uncertainty…
But in the middle of all that chaos?
📈 The chart speaks. And it’s speaking clearly.
🎯 What We’re Watching
On the 8H and 30M chart, DAX has printed a beautiful technical structure. And regardless of how things unfold on the political stage, the price action is offering us a clean framework.
🔹 Key S/R at 20,552
We are hovering around this pivotal level. Above it? Bulls regain control. Below it? Things get choppy, fast.
🔹 Main Support: 18,896
This is the level to hold. It’s structurally valid and tested. A break below here triggers the deeper scenario.
🔹 Scenario Breakdown:
Bullish Case (60%) — If 20,552 holds, DAX can re-ignite a rally toward:
22,248: interim resistance
23,870: all-time high zone
28,035: macro extension target
Bearish Case (40%) — If the key level is lost and we fall through 18,896, look out below:
16,978 minor support
14,408 becomes the "bad scenario" support
🔄 So… What Now?
We're not fortune tellers, and this isn't about guessing what the next political headline will be. We don’t need to understand the full implications of the euro/dollar dynamic or predict whether Germany will pivot on energy policy.
This is about the chart. Period.
📌 Above 20,552? I’m long toward 22K+
📌 Below it? I prepare for the slide
⚠️ Key decision zone right now. Market structure is everything.
Don’t get caught up in macro debates. The world may be unstable — but price action remains our anchor.
Trade the level, not the noise.
One Love,
The FXPROFESSOR 💙

de30 buy tradeThe Relative Strength Index (RSI) is showing an upward trend, indicating increasing momentum. Additionally, the Moving Average Convergence Divergence (MACD) is showing a bullish crossover, further supporting the potential for an upward move.
DAX40 INTRADAY oversold bounce capped at 21520The DAX40 continues to exhibit bearish sentiment, aligning with the prevailing downward trend. Recent price action suggests that the index experienced an oversold rally, which was subsequently rejected near a key resistance zone — the previous intraday consolidation level around 21,520.
This area now serves as a critical pivot point. A failure to break above 21,520, followed by renewed selling pressure, would likely confirm a bearish reversal, with downside targets at:
20,333 – Near-term support
19,557 – Medium-term support
18,780 – Long-term support level
However, if price breaks and closes firmly above 21,520 on a daily basis, the bearish scenario would be invalidated. In that case, the DAX40 could extend gains toward:
21,880 – Immediate resistance
22,330 – Major upside target
Conclusion
The bias remains bearish below 21,520, with rallies into that level offering potential short opportunities. A daily close above 21,520, however, would shift sentiment and open the door for bullish continuation toward higher resistance levels.
This communication is for informational purposes only and should not be viewed as any form of recommendation as to a particular course of action or as investment advice. It is not intended as an offer or solicitation for the purchase or sale of any financial instrument or as an official confirmation of any transaction. Opinions, estimates and assumptions expressed herein are made as of the date of this communication and are subject to change without notice. This communication has been prepared based upon information, including market prices, data and other information, believed to be reliable; however, Trade Nation does not warrant its completeness or accuracy. All market prices and market data contained in or attached to this communication are indicative and subject to change without notice.

Dax Monthly - hitting fib cluster levelDAX monthly chart hitting fibonacci extension cluster level
The Dax typically leads the Dow to some degree, and has a deeply overbought RSI now at a potential resistance zone
Likely to have a retracement in the short to medium term
Not trading this, but highlighting as it may indicate that other western indices may follow suit and struggle to increase in the next 2-6 months
