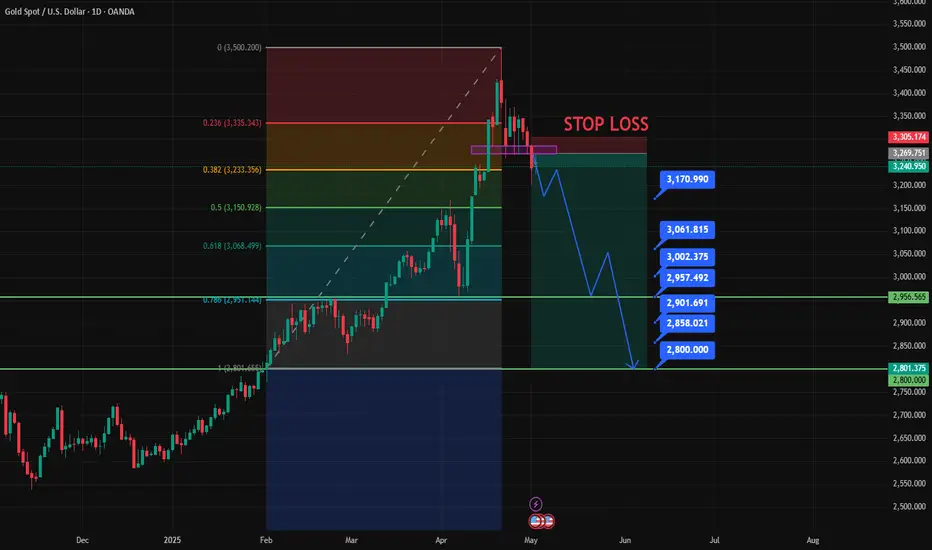
XAUUSD- Signal to go down - 24/04/2025- With any macro economy problem, Gold & BTC are always the key asset to to shelter cash flow.
- From Gold H1 chart, It showed strong selling pressure recently. A short plan is reasonable with Gold. Of course, any plan can be wrong, but as a trader & value investor, we have to have the plans to deal with it and prepare to buy more good stocks, assets
- Explain the chart as - NCI system:
1. Strong momentum comes to down key level of H1
2. Big money comes in, Key level has not broken yet. But high probability Gold will go down.
3. Zone & Trend are shown on chart. Please refer on it for more detail
This analyzation is my personal view as a trader - investor, it's not a recommended deal.
GOLD trade ideas

XAUUSDThis 4-hour chart of Gold Spot / USD (XAU/USD) presents a bearish outlook based on the following technical analysis:
Key Highlights:
EMA Indicators:
EMA(9) is shown in blue and EMA(21) in orange.
Price is trading below both EMAs, suggesting bearish momentum.
Trendline & Price Action:
A descending trendline is respected with multiple rejections.
Price failed to break above this trendline, signaling continued downward pressure.
Fibonacci Retracements:
Key fib levels from the previous swing high to low:
0.382 at ~$3,271.91
0.5 at ~$3,260.83
0.618 at ~$3,250.13
Price is hovering between 0.5 and 0.618 retracement levels, which often act as reversal zones.
Support & Resistance Zones:
Daily Resistance: Around $3,290.20
Daily Support: Around $3,222.94
Multiple lower demand zones are marked:
$3,201.96 (minor)
$3,124.01 (1.618 fib extension)
$2,997.87 (2.618 fib extension)
$2,969.96 (major daily demand)
Projected Move:
The blue arrows suggest a break below $3,201.96 could lead to a drop toward:
$3,124.01 (1.618 extension), then
A potential pullback before resuming bearish trend
Ultimately targeting ~$2,997.87 and $2,969.96 (major demand)
Summary:
The chart suggests a short bias unless price breaks convincingly above $3,271–$3,290. The next bearish targets are $3,124 and $2,997, supported by the trendline, EMA resistance, and fib extensions.

Gold Updates before NY - XAUUSD Tuesday May 6, 2025GOLDMINDSFX | XAUUSD 1H Updated Probable set-ups
Current Price: 3379 | 6 May 2025
Gold plays games. We play levels.
HIGH-PROBABILITY SELL REACTION ZONES (listed lowest to highest)
🔴 3382–3387 ⚠️
Trigger: 5M CHoCH + M-pattern
Note: This is a liquidity tap zone where price may react sharply. Quick reaction expected — not a trend changer.
Confidence: ⚠️ Short-term scalp opportunity with structure rejection
🔴 3404–3410
Trigger: LTF rejection + BOS
Note: Classic reversal zone after sweeping major liquidity. If we reject here, this may offer the best structured sell of the day.
Confidence: Strong structure-based sell zone
🔴 3425–3432 ❄️
Trigger: 1M CHoCH or sweep + engulfing
Note: Final institutional sweep zone above the visible range. If price pushes here without rejection, we wait. If it rejects, this is the sniper zone.
Confidence: ❄️ High-risk, high-reward level — confirmation mandatory
HIGH-PROBABILITY BUY REACTION ZONES (listed lowest to highest)
🟢 3303–3310
Trigger: 5M CHoCH + rejection wick
Note: Clean origin of bullish structure with unmitigated demand. If price returns, this may offer a strong long with confluence.
Confidence: Solid demand zone aligned with structure
🟢 3333–3340 ⚠️
Trigger: 1M CHoCH + wick rejection
Note: Riskier buy zone near premium — only valid with strong confirmation. Can become liquidity before deeper drop.
Confidence: ⚠️ Caution advised — use only with clear LTF reversal signs
FINAL STRATEGY
Sell interest builds heavily between 3382–3432 — structured reactions expected at key levels
Buy interest valid only below 3340 — anything higher is impulsive
No confirmation = no entry — we trade structure, not feelings
📌 Important Notice!!!
The above analysis is for educational purposes only and does not constitute financial advice. Always compare with your plan and wait for confirmation before taking action.

Gold UpdateKey Entry : 3369 - 3366
TP 1 : 3406
TP 2 : 3430
TP 3 : 3442. TP 3 is difficult before correction.

Gold Breaks Wedge, 3270–3280 Now Key Pivot for RecoveryGold's recent retreat has slowed, forming a descending wedge pattern that has now been broken. This is a constructive setup for a potential upward reaction after falling $300 from the $3,500 high. The 3,270–3,280 zone is now the short-term pivot point. If this level breaks as well, the upward move may finally begin.
Potential targets include the 38.2% retracement level at 3,316 and the main resistance zone at 3,355–3,370.

XAUUSD Take ProfitThe gold trade I shared a few hours ago has hit Take Profit at the RRR 1:2 level. This was the second TP level.
For those who wish, you can hold the trade until the TP level at 3206.35.
If the price approaches this level, don’t forget to move your SL to the entry point.
Wishing everyone a pleasant end to the day.
🔔 I post detailed trade ideas and daily market analysis like this every day on my TradingView profile.
👉 Follow me to get notified and read the full breakdowns.

GOLD FOMC Interest Rate Decision (May 7, 2025)
The Federal Reserve held rates steady at 4.25%–4.50%, maintaining its stance since December 2024. The decision reflects heightened uncertainty from escalating U.S.-China trade tensions and mixed economic signals, including stagflation risks (rising unemployment and inflation). Chair Jerome Powell emphasized vigilance toward trade policy impacts but avoided signaling imminent rate cuts, despite market expectations for easing later in 2025.
Geopolitical Conflicts Affecting Gold Prices
U.S.-China Trade War Escalation
New tariffs and retaliatory measures have intensified safe-haven demand for gold. Prices hit record highs in April 2025 (NT$3,518/gram in Taiwan) as investors sought protection from market volatility.
Renewed trade talks (e.g., U.S.-China meetings in Switzerland) caused a brief 1.3% gold price dip on optimism, but analysts project prices to rebound to $3,500–$4,000/oz by late 2025 amid unresolved tensions.
Central Bank Gold Accumulation
Central banks, led by China and Russia, are aggressively stockpiling gold to diversify from USD assets and hedge against sanctions.
Prolonged military tensions continue to drive gold’s role as a crisis hedge. Escalation could push prices higher, while de-escalation might temporarily reduce demand.
Middle East Instability
Conflicts between Iran and Saudi Arabia disrupt global supply chains and energy markets, amplifying gold’s appeal as a safe haven during periods of heightened risk.
Dollar Weakness and Inflation Risks
A declining U.S. Dollar Index (-0.3% on May 7) and tariff-driven inflation fears have bolstered gold’s attractiveness. The Fed’s cautious stance on rate cuts reinforces gold’s appeal in a negative real yield environment.
Gold Price Outlook
Short-term: Prices may face volatility from trade talk progress or Fed policy shifts but remain supported by geopolitical risks and central bank buying.
Long-term: Analysts (e.g., UBS, Bank of America) forecast gold reaching $3,500–$4,000/oz in 2025 due to structural demand, tariff impacts, and unresolved global conflicts.
In summary, gold’s trajectory hinges on geopolitical stability, central bank actions, and Fed policy, with bullish momentum likely to persist amid fragmented global trade and economic uncertainty.

There is too much news supporting the increase in gold prices.🔔🔔🔔 Gold news:
➡️ Gold prices extended their rebound for a second straight day on Tuesday, driven by seemingly unstoppable buying interest amid growing pessimism surrounding the U.S. dollar and escalating geopolitical tensions in the Middle East.
➡️ Despite renewed optimism that the United States may reach trade agreements with some partners this week, President Donald Trump's unpredictable trade policies continue to create market uncertainty, supporting gold's recovery after previous losses.
Personal opinion:
➡️ Trade and geopolitical headlines dominate, and speculation of interest rate cuts ahead of the Fed meeting and comments from Chairman Jerome Powell. There is too much news to support gold's bullish momentum at this time.
➡️Analysis based on important support and resistance levels and Fibonacci combined with trend lines to come up with a suitable strategy
Plan:
🔆Price Zone Setup:
👉Buy Gold 3221- 3223
❌SL: 3217 | ✅TP: 3227 - 3332 – 3337
👉Sell Gold 3402 - 3404 (Scalping)
❌SL: 3408 | ✅TP: 3298 - 3294 – 3290
👉Sell Gold 3417- 3420
❌SL: 3424 | ✅TP: 3414 - 3410 – 3405
FM wishes you a successful trading day 💰💰💰

Gold Intraday Trading Plan 5/6/2025As mentioned yesterday, a break above 3270 will signal the end of correction. Indeed after breaking the resistance, gold has gone up all the way to 3330. Right now there is a strong resistance at 3350. I will trade its breaking of structure or retest from 3270.
This is my strategy for today:
1. if 3350 is broken, upon retest, buy towards 3400 or even 3450.
2. Buy from 3270, 1st target 3350, 2nd target 3400

Gold Intraday Trading Plan 5/2/2025As predicted yesterday, gold indeed broke 3270 support and went down just above 3200. Currently it looks pretty bearish in daily and below timeframes. But in higher timeframes, it is still bullish.
Since gold has hit my weekly target, I will be cautious to take any selling order today. Mainly because it's NFP day. We may see big market manipulation.
Nevertheless, I will closely monitor the resistance level of 3261-3271. If it holds, I will sell towards 3200 or even 3165. If it is broken, the correction could be over.

XAUUSD1. The Fed's interest rate decision dominates this week's market
(May 7) The Fed will announce the May FOMC interest rate decision and press conference. The market generally expects the interest rate to remain unchanged, but Powell's speech will be the key. The April non-farm payroll data was stronger than expected (an increase of 177,000 people), coupled with the Fed's concerns about inflation, Powell may continue his hawkish stance and emphasize "anti-inflation priority". If he releases a signal of "delayed interest rate cuts", it may suppress gold bullish sentiment; on the contrary, if it implies concerns about economic slowdown, gold may be supported. In addition, several Fed officials will go to Iceland to participate in an economic meeting on Friday, and we need to pay attention to their statements on monetary policy.
2. International trade situation disturbs market sentiment
Sino-US trade frictions continue to escalate, with the US imposing tariffs on China as high as 245% and hitting China's re-export trade. However, the US has recently released a signal of easing, with companies such as Walmart resuming orders from China and bearing tariff costs, showing that US companies have limited tolerance for high tariffs. China requires the US to cancel unilateral tariffs as a prerequisite for negotiations, and the prospects for negotiations remain unclear. In addition, the situation between India and Pakistan is tense again, and the rising geopolitical risks may boost demand for gold as a safe haven.
3. Market sentiment and capital flows
Domestic gold ETF holdings surged by 23.47 tons in the first quarter, indicating that institutional investors are optimistic about gold in the long term. However, Nomura Securities warned that gold may face a technical correction due to abnormal capital flows (GLD funds in and out) and overheated technical indicators (gold prices deviated from the 200-day moving average by 25%). In addition, COMEX gold speculative net long positions hit a 14-month low, and market sentiment was cautious.

Gold short Short from 3425$ region.
Gold has to retrace before it keeps going higher.
Let us first wait for 3400 region.

"XAUUSD Double Setup After Massive Manipulation! 200+ Pips"🚨 Gold (XAUUSD) Smart Money Play Unfolding!
Here's a clean breakdown of the current structure and why this could be a high probability setup:
🔥 First, notice the manipulation zone — classic Smart Money move where liquidity was grabbed aggressively before a shift in market structure. This sets the stage for a bigger play.
📉 Change of Character (ChoCh) confirmed after the sweep, showing clear intent for price to reverse. This is the first signal that buyers are losing control and sellers are stepping in.
📍 First Key Area: Fair Value Gap (FVG)
Price is now retracing into the FVG.
This is our 1st Entry Setup opportunity.
High R/R setup if rejection happens around this level.
📍 Second Key Area: Order Block (OB)
A stronger zone for deeper mitigation.
If price pushes through the FVG, this OB becomes a prime entry spot.
This is the 2nd Setup for another potential short entry.
🏹 Targets and Pip Count:
Immediate target zone offers around 211 pips from the first setup.
Deeper target from second setup offers up to 253 pips move.
🧠 Market Structure & Psychology:
After manipulation, Smart Money always seeks to rebalance inefficiencies (FVG) and mitigate institutional orders (OB).
Weak lows created will likely be swept to fuel the bigger move down.
Multiple liquidity pools above and below current price hint at another round of liquidity hunting.
⚡ Game Plan:
Monitor price action reaction around FVG for short triggers.
If broken, reposition entries at the OB zone.
🚀 Risk Management Reminder:
Always use calculated risk per trade.
Don't chase; let price come to your zone.
Protect capital first, then maximize profits.
✍️ In summary:
This setup shows classic Smart Money Concepts in action: manipulation, structure shift, FVG, OB mitigation — all aligning for a clean bearish move. If executed with patience, this could be one of the smoothest setups of the week!
➡️ Comment "GOLD READY" if you’re stalking this setup with me!
➡️ Tag your trading buddy who needs to see this!

XAU DAILYdear all my friends.
our channel that reached LSS level is best trade zone for today.
waiting for a confirmation.
break up or down as this ez.
carefull for USD NEWS :
I WILL UPDATE IT SOON AND SHARE SETUP

XAUUSD Sharp Decline : - Gold experienced a significant drop , reaching a low point around 1st May , looks like it's working on a recovery phase after bottoming out , there is significant bullish momentum play on today's chart.
However the current price is approaching a KEY RESISTANCE @ $3265-68.
KEY ZONES
Go for BUY ORDERS if PRICE breaks $3268.60 and shows strong BULLISH MOMENTUM.
MACD Analysis - is showing strong a BULLISH CROSSOVER with increasing HISTOGRAM BARS, which suggests strong Upward Movement.
HEAD AND SHOULDERS pattern seen indicating POSSIBLE REVERSAL .
A bullish triangle is as well idnetified from the chart indicating UPWARD MOMENTUM.
OVERALL we are BULLISH TODAY, but keep in mind that we still have the CONSOLIDATION PHASE in play.

Gold Triangle Pattern Breakdown? Bearish Setup in Play (XAU/USD)Gold (XAU/USD) has been trading within a tightening consolidation range over the past several sessions, characterized by lower highs and a horizontal support level. This behavior has resulted in the formation of a descending triangle, which is commonly interpreted as a bearish continuation pattern—especially when occurring in a downtrend.
Following a failed attempt to sustain above the $3,400 level, price action has steadily weakened, showing signs of bearish pressure. Recent structure breakdown below the triangle’s lower boundary suggests that the bulls are losing control, opening the door for a potential leg down.
🔍 Technical Structure Breakdown
📐 Triangle Pattern
Formation Type: Descending Triangle
Support Level: ~$3,245
Lower Highs Resistance: Downward sloping line, showing consistent bearish pressure.
Breakdown Confirmation : Clear move below triangle support, followed by a retest and rejection, confirming bearish momentum.
🔄 Key Support & Resistance
Resistance Zone: $3,300–$3,340
This area has acted as a supply zone, where sellers continue to overpower buying attempts. The price has failed multiple times to break above this region, creating a solid resistance cap.
Support Level (Previous Base of Triangle): $3,245
Price repeatedly bounced off this level before the final breakdown, making it a significant level for validation of the pattern.
Next Key Support/Target: $3,155
The projected move is derived by measuring the height of the triangle and subtracting it from the breakout point. This target also aligns with a previous demand zone, increasing its relevance.
➰ Black Curve Line (Dynamic Resistance)
This curved resistance line adds further technical weight to the downtrend. It’s a visual cue of how momentum is progressively shifting downward. The curve reflects a deceleration in bullish effort, a warning signal often preceding breakdowns.
⚙️ Trade Plan: Bearish Bias
Component Level
Entry Zone $3,265–$3,270 (retest of breakdown)
Stop Loss $3,317 (above triangle and curve line)
Take Profit $3,155
Risk-Reward Ratio : ~2.5:1 (based on entry near $3,270, SL $3,317, TP $3,155)
Setup Type : Breakdown + Retest (high-probability pattern continuation setup)
⚠️ Risk Management & Confirmation Factors
Confirmation Needed: A clean hourly candle close below the support zone, followed by rejection wicks on retest, strengthens the case for short entries.
Invalidation : A strong bullish break above $3,317 (stop level) invalidates this setup and could signal a reversal or false breakdown.
Volatility Note : Be mindful of macroeconomic events or FOMC-related headlines that may trigger increased volatility in precious metals.
📊 Conclusion & Trader Sentiment
The descending triangle in gold is a textbook example of consolidation under pressure. With sellers continuously pushing price into lower highs while buyers cling to horizontal support, the eventual outcome often favors the dominant trend—which in this case is bearish.
The current structure offers a clean technical setup for short traders with well-defined risk levels and a logical downside target. As always, ensure strict adherence to risk management principles and stay aware of market news that could impact gold volatility.
📌 Tag Ideas:
#XAUUSD #GoldAnalysis #TrianglePattern #BreakdownSetup #TechnicalAnalysis #PriceAction #BearishTrade #MetalsTrading #ShortSetup #ForexIdeas

Gold Price Analysis May 1The D1 candle has broken out in a bearish direction. It is not surprising that the price broke Dow and decreased according to yesterday's Plan.
Gold confirmed the selling side won, so today's strategy is to watch for SELL. The SELL point pays attention to the 2 break zones of 3270 and 3302. The BUY point with the Scalping element pays attention to 3216 and today's main support is 3195.
The current trading strategy is that gold is approaching the 3237 resistance. If it confirms closing above this zone, it will give a BUY signal to 3251 and consider the price reaction of the US session. If it breaks 3241, it will hold until 3270. On the contrary, if it does not break 3237, it can SELL to 3216 and trade according to the noted port zones.

GOLD: Remains Bullish With Low MomentumGOLD: Remains Bullish With Low Momentum
In today's video, I discussed potential price movements for gold in the coming days. While the overall trend remains bullish, uncertainty is still present.
Be careful, the direction of gold is still unclear despite the strong upward momentum.
Volume is very low as the precious metal has been stuck in a range-bound trading zone so far.
You may find more details in the chart!
Thank you and Good Luck!
❤️PS: Please support with a like or comment if you find this analysis useful for your trading day❤️

GOLD WILL DROP MORE !!HELLO TRADERS
As i can see Gold break 3300 levles which was expected a Strong Support Zone for a new ATH
but its rejected and now we had saw a Trade War Talks on Going with US and China to be compromise soon on Friday we saw NFP results was good for Dollar and now after closing markets under 3260 is a clear sign for us for a more incoming drop in precious metals Gold Long Term View is still bullsih but markets always not move in one direction so it a great trade ida with a very low Risk and higher Rewards we need ur Support and comments Stay Tuned for more Updates ....

Powell's speech determines the trend.Tonight, Jerome Powell, the chairman of the Federal Reserve, will speak again. Whether he will confront Trump head - on is something worth looking forward to. However, it is certain that the Federal Reserve will not raise or cut interest rates today. It will keep the current interest rate. Whether there will be a rate cut in June depends on what Powell says. Therefore, there is great uncertainty about the fluctuation of the gold price tonight. No one can guess whether Powell will be hawkish or dovish now. But I think that regardless of his stance, the medium - and long - term trend of the gold price is optimistic. If he really makes remarks unfavorable to gold, which lead to a temporary slump in the gold price, it may instead be an opportunity for those who haven't bought or are on the sidelines to buy at a low price. So don't pay too much attention to Powell's speech. Moreover, this old man is likely to give a very tactful speech. I think he is very likely to neither offend Trump nor sacrifice the independence of the Federal Reserve. So his speech is likely to be very tactful. Therefore, regarding the fluctuation of the gold price, we need to see his attitude in the speech. Judging from the current performance of the gold price, it has actually shown a standard four - wave adjustment in 5 minutes. When will this four - wave adjustment end? It is likely to be a volatile adjustment during the day today, lasting until the European session or even tonight. After tonight, if the adjustment ends and the support level is clear, then the fifth wave is likely to start. Of course, if Powell's speech at 2:30 a.m. is also favorable to gold, the fifth wave will be even more promising. So we can wait and see what kind of stance Powell will take in front of the world.
you are currently struggling with losses, or are unsure which of the numerous trading strategies to follow, at this moment, you can choose to observe the operations within our channel.

XAUUSD - Entered Massive Supply Zone! Will It Dump or Break OutGold (XAUUSD) is currently trading at $3,429, testing a major supply zone on the 15-minute chart. Price has rallied over +2.84% today and is now facing a key resistance area that previously triggered sharp sell-offs.
Key Technical Zones:
Supply Zone (Resistance): $3,420 - $3,440
Price is now reacting to this heavy-volume resistance area. Watch for rejection or breakout confirmation.
Mid-Level Support: $3,344
Strong structure level where previous consolidations and rejections occurred.
Demand Zone (Support): $3,223 - $3,227
Price bounced from here with a strong bullish impulse. This is our major demand base.
What to Watch:
Bearish Scenario: Rejection from supply zone could send price back toward $3,344, then $3,227.
Bullish Breakout: Clean break and retest above $3,440 opens the door to new highs.
Confirmation Tools:
LuxAlgo's Supply & Demand Visible Range shows clear institutional activity in these zones.
Look for candlestick confirmation, volume spikes, or divergence signals for entries.
My Plan:
Watching closely for short setups near $3,440 unless we get a confirmed breakout. If rejected, I’ll target the $3,344 and $3,227 zones.
---
What do you think? Will gold break out or get rejected hard again?
Like and share if you find this helpful — let’s grow together!

Gold Technical Analysis Update:(XAUUSD)OANDA:XAUUSD
Not much has changed since my last update—gold remains stuck in the same range-bound, triangle pattern we've been tracking. The price action is definitely tightening, which usually means we're getting closer to a decisive breakout.
Key Levels:
- Support: 3300 is holding firm as a strong support level.
- Resistance: 3350 continues to cap the price as a major resistance, keeping gold within a wide range.
My outlook remains bearish for the short term, especially as gold is still trading below the golden Fibonacci zone (3375-3420). The weekly close also confirmed that sellers remain in control for now.
Today’s monthly close is particularly important and could set the tone for the next move:
- If gold finishes below 3330, this will strengthen the bearish outlook and open the door for a drop towards 3250, 3200, 3150, and even 3070.
- However, a breakout above the triangle and 3350 would force a reassessment of the short-term direction.
For now, I’m waiting for a clear breakout from this range to confirm the next major move.
Personal trade plan:
- I believe we can enter a sell trade here, with targets at 3250/3200/3150/3070.
- My stop loss is set at a 4-hour candle close above 3335.
As always, manage your risk and trade wisely. Good luck, traders! 🏆💰
