FLAG AND POOL PATTERN - XAUUSDXAUUSD
📊 Price Summary:
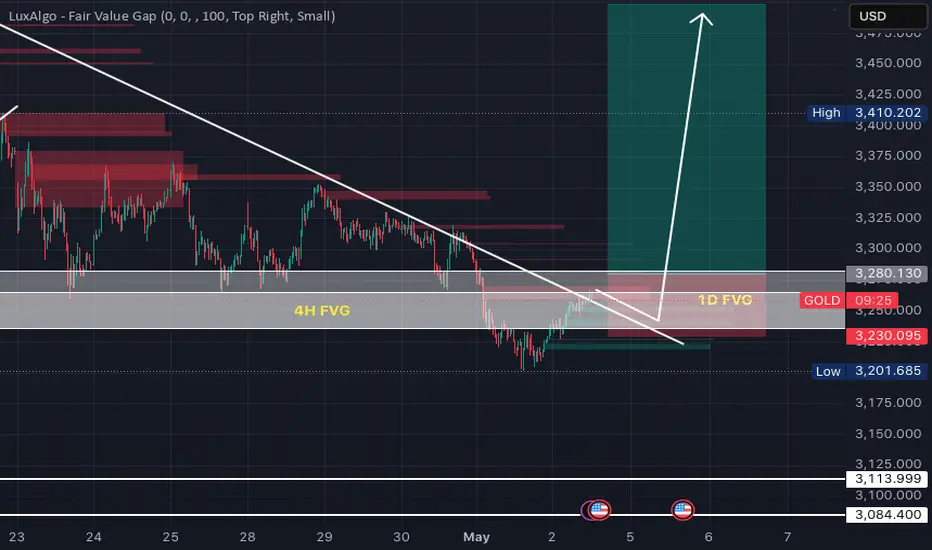
Low: 2951
High: 3498
Current Price (as of 3 May 2025): 3240
Pattern Identified: Flag and Pole, with potential breakout
Possible Pullback: To around 3175 before breakout
🧠 Technical Analysis View:
The flag and pole is a bullish continuation pattern, especially when the prior trend (the "pole") is steep and strong — which it is in this case (2951 → 3498).
A pullback to 3175 would represent a healthy retracement (~50% of the flag range), allowing the market to reset before a potential breakout.
🔍 Key Levels to Watch:
Support zone: 3175 – 3200 (watch for rejection or consolidation here)
Resistance (breakout zone): ~3255–3275 (if broken with volume, confirms breakout)
Target after breakout:
Measured move projection = Height of pole (~547 pts) → 3498 + 547 ≈ ~4045 (longer-term target if clean breakout)
Conservative target: 3350–3450 area
⚠️ Risks:
If 3175 breaks down with volume, pattern might fail — watch next support near 3120–3100.
Gold often reacts to macroeconomic events, USD strength, and interest rates, so keep fundamentals in mind.
GOLD trade ideas

GOLD (XAU/USD, 4H) updateOn the 4-hour chart, GOLD has broken below the lower boundary of a pennant pattern on increasing volume, signaling potential for continued downside. Despite this, the asset remains within the confines of a bullish megaphone structure, whose boundaries are still intact. The EMA indicators (20/50/100/200) are aligned in a bearish sequence, exerting downward pressure. The price is consolidating below the $3295 level and is approaching key demand zones.
Near-Term Downside Targets:
- $3177 — Intermediate demand zone
- $3063 — Major support level
Technical Highlights:
- Breakdown from bearish pennant confirmed by volume
- Price action continues within the bullish megaphone pattern
- EMA 20/50/100/200 positioned above price, indicating overhead resistance
- Volume increases observed during downward moves
- Key buyer interest zone: $3060–$3080
- Resistance zone: $3295–$3305
Following the breakdown from the consolidation pattern, gold is exhibiting a downward trajectory targeting support zones at $3177 and $3063. The bearish scenario is technically confirmed as long as the price remains below $3295. However, the movement within the bullish megaphone structure warrants close monitoring for potential shifts in momentum.

GOLD PREDICTION-BEARISH FOR NOWIs gold predicted to go up or down?
SEE THE CHART FOR YOUR REFERENCE!

XAUUSD SIGNAL UPDATE READ THE CAPTAIN(xauusd signal technical analysis satup 👇🏼
( XAUUSD) BUY zone
( TRADE SATUP)
ENTRY POINT (3258) to (3256) 📊
FIRST TP (3262)📊
2ND TARGET (3267) 📊
LAST TARGET (3272) 📊
STOP LOOS (3148)❌
FALLOW RISK MANAGEMENT ✅

Gold recovers after deep fallWorld gold prices recovered to 3,238 USD/ounce on the morning of May 2 after hitting a bottom of 3,205 USD/ounce last night. The reason came from the sell-off when the Chinese market was on a long holiday, causing a lack of physical buying power.
However, investors quickly took advantage of this opportunity to buy, amid expectations that the FED would lower interest rates and central banks would continue to collect gold as a safe haven asset. The 4-hour chart shows that the price has bounced back from EMA89, heading towards the EMA34 resistance zone - a positive sign for a short-term recovery.

XAU/USD For Bearish as pull-backwait for pull-back near by entry point and then go short
general trend is up trend
current phase is pull-back
have fun :)

GOLD GOLD ,TAKE PROFIT IS NORMAL ,but the trend remains bullish on safe demand .
the 3222-3217 and 3210 might provide a buy back as the structure indicates strong buy structure with hope of 400-500pips pips booking in buy profit which meet a resistance structure at 3283-3290
my best zone for buy 3207 and if we get a retest the selling might continue below 3200 level.

Bullish Breakout Defies Trade Uncertainty and Global TensionsOANDA:XAUUSD Gold remains firm near $3,333, holding a bullish structure after a breakout above multi-year resistance. While short-term pullbacks persist, geopolitical tensions and a Fed pause continue to support safe-haven demand. Trump's refusal to ease China tariffs dampens trade optimism, further boosting gold's appeal. Key support lies around $3,333 and $3.273.
Resistance : $3,414 , $3,474
Support : $3,333 , $ 3,273

Bullish or bearish? (Read description). As of May 7, 2025, the XAU/USD (gold) market is experiencing fluctuations influenced by a combination of geopolitical developments, economic indicators, and central bank policies. 
⸻
📉 Recent Market Movements
Gold prices recently declined by 1.3% to $3,383.88 per ounce, retreating after nearly a 3% rise the previous day. This drop comes amid growing optimism over U.S.-China trade negotiations, diminishing the appeal of safe-haven assets like gold. Additionally, markets are focused on the Federal Reserve’s policy decision expected later in the day, with the central bank likely to hold interest rates steady while maintaining flexibility due to uncertainties from the trade war. 
⸻
🔮 Outlook for XAU/USD
Despite the recent pullback, the long-term outlook for gold remains bullish. Goldman Sachs projects that gold will continue to outperform silver due to sustained central bank demand, which has structurally elevated the gold-silver price ratio. Currently, the ratio stands at approximately 102, up from 84.7 a year ago. Factors such as slowing Chinese solar production, high recession risks, and robust bullion purchases by central banks contribute to gold’s stronger performance. Goldman Sachs maintains a bullish outlook on gold, forecasting a base price of $3,700 per ounce by year-end and $4,000 by mid-2026. 
⸻
📊 Technical Analysis
A key resistance level is observed at $2,660, with support around $2,600. A breach below this support could lead to further downside towards
$2,500.  
⸻
⚠️ Key Factors to Monitor
• Federal Reserve’s Policy Decisions: Anticipated rate cuts could influence gold’s appeal.
• Geopolitical Tensions: Ongoing conflicts may drive demand for safe-haven assets.
⸻
✅ Conclusion
While short-term fluctuations are expected, the long-term prospects for XAU/USD remain positive, supported by strong demand from central banks and geopolitical uncertainties. Investors should monitor key economic indicators and central bank policies for potential impacts on gold prices.  
⸻

XAUUSD /GOLD Trade Setup: Bullish (Buy)
Entry Price (Buy Limit):
Around $3,385 – This is near the retest zone (support) after the breakout and the top of the demand block from earlier.
Stop Loss:
Below the demand zone low, around $3,370 – This gives room in case of a liquidity sweep but protects against a structure break.
Take Profit (TP1 / Conservative):
Around $3,410 – This is below the upper supply zone to secure profits before potential reversal.
Take Profit (TP2 / Extended):
Around $3,425–3,430 – Closer to the full retest of the supply zone above for extended profits.

Potential Bullish Price Action on Gold.This setup suggests gold is about to take out the previous high. Looking forward to seeing how price plays it out today.

Daily Analysis- XAUUSD (Wednesday, 7th May 2024)Bias: Bullish
USD News(Red Folder):
-None
Analysis:
-Strong pullback on market open
-Looking for price to retest 0.5 fib level
-Potential BUY if there's confirmation on lower timeframe
-Pivot point: 3310
Disclaimer:
This analysis is from a personal point of view, always conduct on your own research before making any trading decisions as the analysis do not guarantee complete accuracy.

Wed 7th May 2025 XAU/USD Daily Forex Chart Buy SetupGood morning fellow traders. On my Daily Forex charts using the High Probability & Divergence trading methods from my books, I have identified a new trade setup this morning. As usual, you can read my notes on the chart for my thoughts on this setup. The trade being a XAU/USD Buy. Enjoy the day all. Cheers. Jim
Note: This isn’t a great setup as price is already at the previous high and the MACD is just below the zero level. But I had to take it because I am committed to my MSH (multi sequence hedging) strategy. So if you are a traditional type trader, then standing aside on this trade would probably be the smart thing to do.

XAUUSD SIGNAL UPDATE READ THE CAPTAINXauusd signal technical analysis satup 👇🏼
( Xauusd ) Sell zone
( TRADE SATUP)
ENTRY POINT (3366) to (3364) 📊
FIRST TP (3357)📊
2ND TARGET (3346) 📊
LAST TARGET (3335) 📊
STOP LOOS (3375)❌
FALLOW RISK MANAGEMENT ✅

GOLD SWING XAUUSD took support form bottom - up Line.
All long targets are achieved
This month taking rejection from major resistence,
Let's track the moves from Top down line.
Follow for more swing analysis for INDICES - CURRENCY - COMMODITIES

GOLD SHORThe price of 📉GOLD is likely to keep falling, following a significant downward trend.
After consolidating within a horizontal range on a 4-hour time frame, the support of the range was recently broken, signaling strong selling pressure and a probable continuation of the bearish trend.
It is possible that the pair will soon reach the 3200 support level.Then it will go for3166 level

Gold’s Golden Bounce: Eyes on 3,293 & Beyond!
Gold has shown a strong reaction from the demand zone near 3,210–3,227, suggesting buyers are stepping in with conviction. The current bullish momentum is targeting the 3,293 resistance level, where we may see price either break through or reject back toward support for a potential higher low.
Key Levels:
Support Zone: 3,210–3,227 (green box)
Immediate Target/Resistance: 3,293
Major Supply Zone: 3,334–3,366
Two Scenarios to Watch:
1. Bullish Continuation: Price pushes directly to 3,293 and challenges higher supply zones.
2. Healthy Pullback: A retracement to the demand zone before a renewed bullish push.
Traders should watch for price action confirmation at key levels to plan entries. Will gold maintain this bullish momentum or face resistance heat ahead?

XAUUSD LONGBased on fundamental factors, gold pushing higher makes sense and technicals seem to be showing we could be at a potential spring (Wyckoff)

Gold Analysis Break Out SupportGold Analysis Break Out Support waiting for retest and opportunity to short entry.

Gold Short: Update to wave counts and H&SThis is an update to the Gold short idea that I posted yesterday. I showed how we can draw another head-and-shoulders and demonstrated how to use Fibonacci extensions set take profit targets.

continue to accumulate, gold price waiting for NF⭐️GOLDEN INFORMATION:
Gold price (XAU/USD) continues its downward trajectory, slipping toward $3,315 during early Asian trading on Wednesday as improving global risk sentiment and signs of easing trade tensions weigh on demand for the safe-haven asset. Market participants remain cautious ahead of key US economic data releases, including the ADP Employment Change, the Core PCE Price Index, and the preliminary Q1 GDP figures, all scheduled for later in the day.
Meanwhile, US President Donald Trump is reportedly aiming to reduce the overall impact of automotive tariffs by avoiding cumulative duties on foreign vehicles and loosening restrictions on imported parts used in domestic production. Treasury Secretary Scott Bessent added that major trade partners have made “very good” proposals to avert further US tariffs. Furthermore, exemptions on select US goods from retaliatory duties suggest a growing intent to de-escalate ongoing trade disputes.
⭐️Personal comments NOVA:
Gold price maintains accumulation range of 3265 - 3360, temporary stability awaits big fluctuations
⭐️SET UP GOLD PRICE:
🔥SELL GOLD zone : 3368- 3370 SL 3375
TP1: $3350
TP2: $3340
TP3: $3330
🔥BUY GOLD zone: $3264 - $3262 SL $3257
TP1: $3280
TP2: $3300
TP3: $3318
🔥BUY GOLD zone: $3285 - $3283 SL $3280 scalping
TP1: $3290
TP2: $3295
TP3: $3300
⭐️Technical analysis:
Based on technical indicators EMA 34, EMA89 and support resistance areas to set up a reasonable SELL order.
⭐️NOTE:
Note: Nova wishes traders to manage their capital well
- take the number of lots that match your capital
- Takeprofit equal to 4-6% of capital account
- Stoplose equal to 2-3% of capital account

XAUUSD Today's Trend Analysis SignalGold has recently broken out of a falling wedge pattern, which is a classic bullish reversal signal, which is also confirmed by a clear bullish divergence near $3,200. After hitting the target level of the falling wedge pattern, the price rebounded sharply and is now forming an ascending channel.
Currently, the price is approaching a key resistance level near $3,280-3,290. If the bulls succeed in breaking through this level, we may see the price rebound to the next major resistance level of $3,320 and above.
Confirmation of Falling Wedge Breakout
Bullish divergence near the bottom indicates a shift in momentum
Price follows an ascending channel structure
Bullish Target: $3,290-3,320
Bearish Target and Long Entry Point: $3,240 Area
Outlook: The bullish bias remains valid as long as the price is above the $3,240-3,250 support level. Watch for the price to break through the resistance level to continue further upward momentum.
